
Disclosure: This article is published by Datamagnet. Vendor claims are self-reported unless otherwise noted.
Technographic Signals: Using Tech Stack Changes to Time Outreach
A prospect just swapped their marketing automation platform. Does your outbound sequence know that, or are you still pitching them like it's a cold list? In 2026, enterprise IT teams add an average of 21 new applications every month (Zylo, "2026 SaaS Management Index," January 2026), and every one of those changes is a moment when the right message can land instead of getting ignored.
Technographic signals — data about what software a company runs and when that changes — are the timing layer most outbound programs are missing. This guide walks through what counts as a real technographic signal, why tech stack churn is such a reliable trigger, and how to build a workflow that turns a detected change into a timed, relevant touch.
Key Takeaways
- Enterprise IT orgs add 21 new apps a month on average, even as total app counts hold flat (Zylo, 2026) — your prospects' stacks are moving constantly.
- The average company's SaaS footprint dropped from 130 tools (2022) to 112 (2023), the first decline in over a decade, as buyers scrutinize purchases harder (BetterCloud, 2024).
- Small, signal-qualified outreach lists reply at 5.8% versus 2.1% for large, untargeted blasts (Belkins, 2025) — precision beats volume.
- Website-scan-based technographic tools miss backend systems entirely, so pair them with hiring, funding, and engagement signals for full coverage.
- Sales/marketing tools churn far faster than infrastructure software, making them the highest-signal category to monitor first.
What Are Technographic Signals?
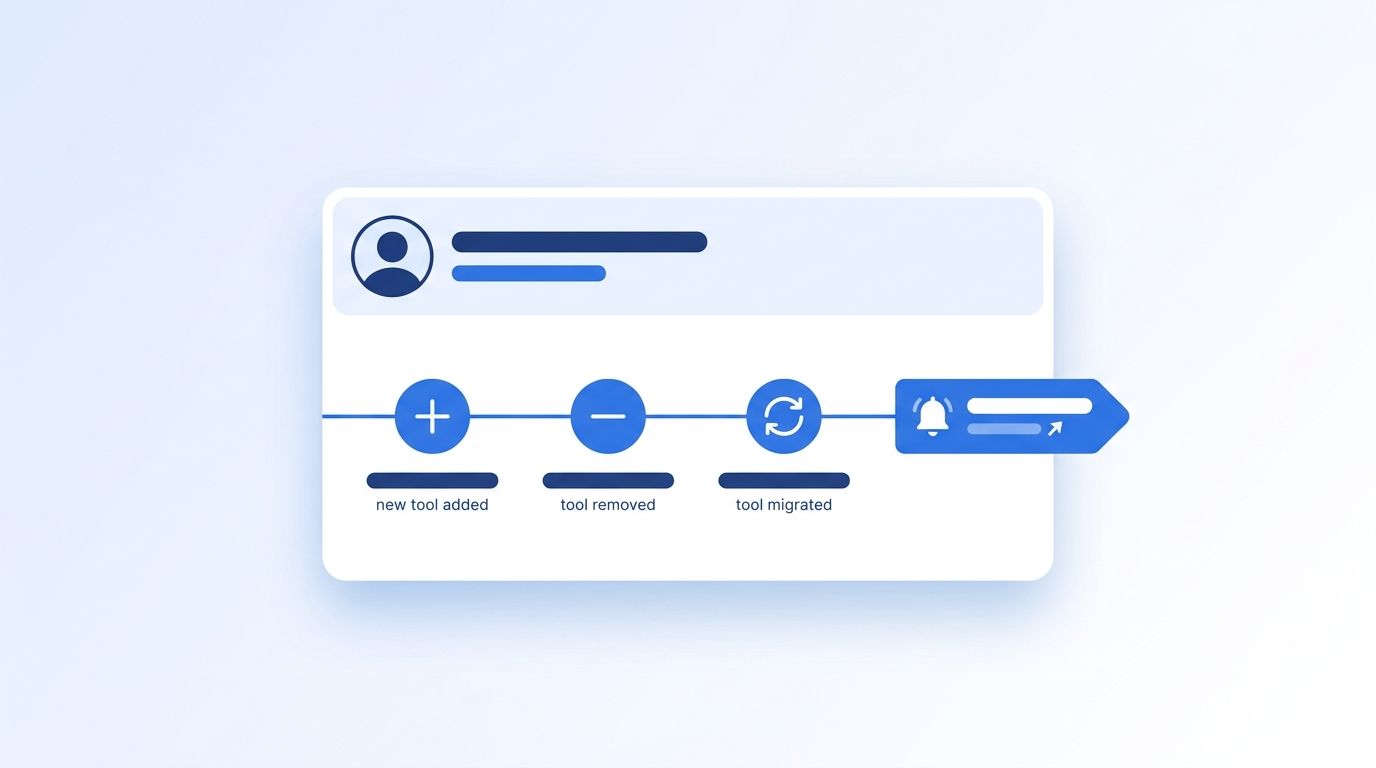
Technographic signals are data points that show what technology a company uses and when its stack changes — a new tool going live, an old one disappearing, or a vendor migration in progress. HG Insights, one of the larger technographic data vendors, claims 90% accuracy across a database covering 13.2 million companies and 236 countries (HG Insights, "Data Quality & Methodology," 2025).
That accuracy claim is self-reported and unaudited, so treat it as a vendor benchmark rather than an independent fact. What matters more for outreach timing is where the underlying data comes from. HG Insights pulls signals from job postings, contracts, RFPs, and public filings, not just website code — which matters because a lot of technographic detection stops at what a scanner can see on a homepage.
Contrast that with pure website-scanning providers. BuiltWith tracks 125,588+ distinct technologies across roughly 500 million domains (BuiltWith, "Market Analysis," 2026), which is an enormous dataset, but it can only detect what's visible in a site's front-end code — trackers, CMS platforms, ad tags, payment widgets. It has no way to see a CRM migration, a new data warehouse, or an internal sales tool, because none of that ever touches a browser.
<!-- [UNIQUE INSIGHT] -->That blind spot is the real reason "technographic signal" and "buying trigger" aren't the same thing. A tool showing up in a website scan tells you what's already live. A tool showing up in a job posting, a funding announcement, or a LinkedIn engagement pattern often tells you what's about to change — which is the window you actually want to catch.
For a practical starting point, Datamagnet's ICP Company Search lets you filter target accounts by technology alongside industry, headcount, and location, so a detected stack change never gets evaluated in isolation from the rest of your ICP.
Why Are Tech Stack Changes Such a Strong Timing Signal?
In 2026, the average company's software footprint isn't static — it's in near-constant motion, and that motion is exactly what makes technographic data useful as a trigger instead of just a firmographic filter. Zylo's 2026 SaaS Management Index, built from analysis of more than 40 million SaaS licenses and $75 billion in tracked spend, found IT organizations add 21 new applications a month even while overall app counts stay roughly flat (Zylo, "2026 SaaS Management Index," January 29, 2026).
That's not a typo — it means companies are replacing tools nearly as fast as they add them. BetterCloud's longest-running SaaS Ops survey found something related from the other direction: the average number of SaaS apps per company fell from a 2022 peak of 130 down to 112 in 2023, the first decline in over a decade of tracking (BetterCloud, "The Number of SaaS Applications at Companies Declined for the First Time in Over a Decade," July 2024). Fifty-two percent of IT leaders in that survey reported tighter purchasing scrutiny.
Why does that matter for your outbound? Because a company actively cutting redundant tools is, by definition, in a buying-and-evaluating mindset right now — not a mindset you can manufacture with a clever subject line. Reaching them during that window beats reaching them six months later when the decision's already made.
Our take: stacks aren't shrinking because companies need less software. They're consolidating because they got tired of paying for overlap — which is exactly the moment a genuinely differentiated pitch gets heard instead of deleted.
Not every category churns at the same rate, either. Industry churn benchmarks aggregated across several SaaS analytics platforms suggest sales and marketing tools turn over at roughly 4.8-8.1% monthly, while core infrastructure software churns closer to 1.8% monthly. If you're picking where to start monitoring, martech and salestech stacks are where the signal-to-noise ratio is best.
The same detection-speed principle applies whether the trigger is a tech stack change, a job change, or a funding event — the faster the signal reaches a rep, the more of that window is still open.
What Are the 3 Types of Technographic Signals Worth Tracking?
Not all tech stack changes carry equal weight, and treating "they use Tool X" the same as "they just replaced Tool X" wastes the timing advantage technographic data is supposed to give you. There are three distinct signal types worth separating in your workflow, each pointing to a different stage of the buying cycle.
New tool adoption is the most obvious signal — a company just turned on a platform your product complements or competes with. It's useful, but it's often lagging: by the time a scanner detects the tool live, the deal that led to it closed weeks ago.
Tool removal or migration is the sharper signal. A company dropping a competitor, sunsetting a legacy system, or actively evaluating replacements is telling you, in real time, that budget and appetite exist right now. This is the window generic prospecting misses entirely.
Hiring-for-a-tool is the oldest technographic proxy in the book: a job posting that names a specific platform as a required skill is a strong hint the company either just adopted it or is about to. It's qualitative rather than statistical — there's no reliable, independently verified percentage for how often a posting precedes a purchase — but as a directional signal layered with other data, it holds up.
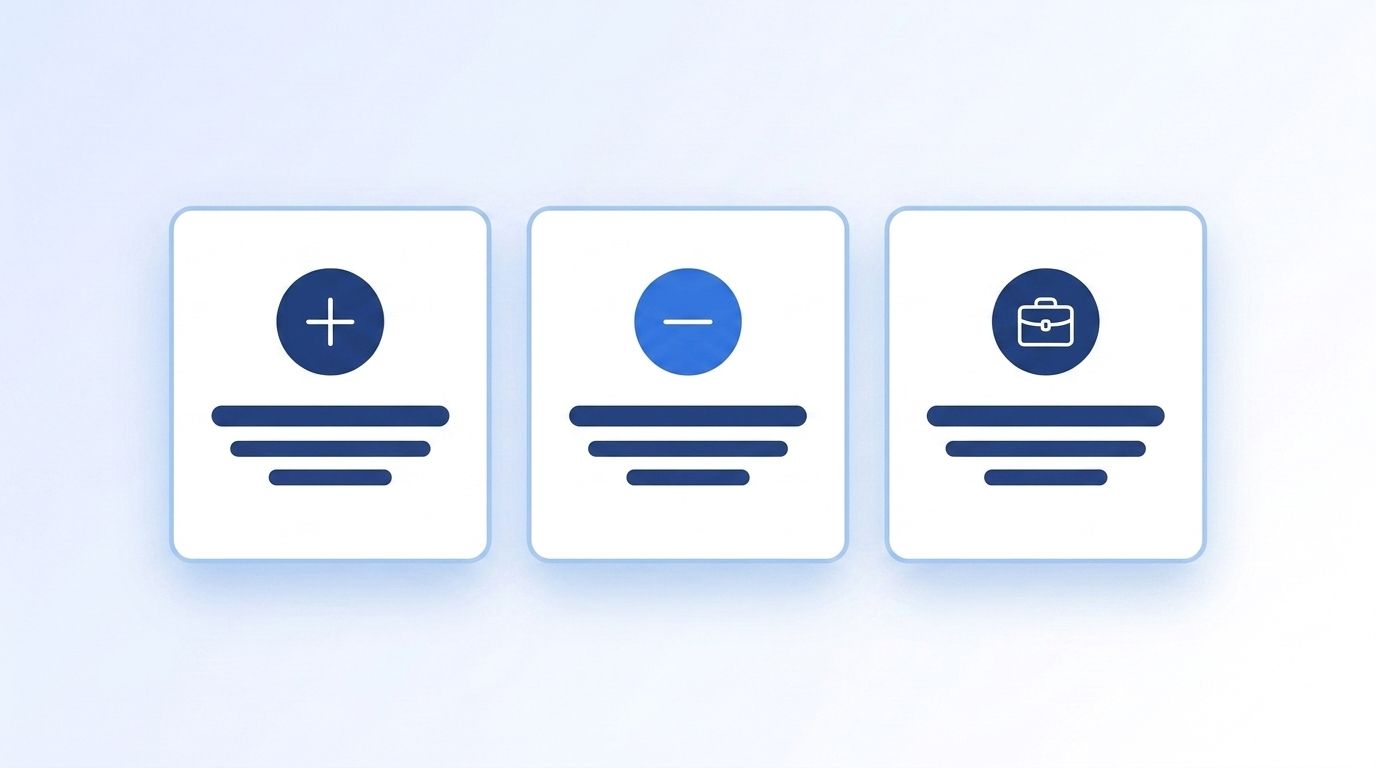
When we look at how these three signal types perform against each other in practice, removal/migration signals consistently produce the shortest gap between detection and an active evaluation — which tracks with the logic above: a company doesn't rip out a tool casually, so the decision behind it is usually already in motion.
How Do You Turn a Tech Stack Change Into a Timed Outreach Trigger?
A detected tech stack change only becomes useful once it's filtered against your ideal customer profile and routed into a workflow fast enough to matter — detection alone doesn't close deals. Gartner's survey of 632 B2B buyers found 73% actively avoid suppliers who send irrelevant outreach (Gartner, B2B buyer research, fielded August-September 2024), which is exactly the failure mode raw technographic data creates when it isn't qualified first.
Here's a five-step workflow that avoids that trap:
- Define the signal you care about. Decide whether you're watching for adoption, removal, or a hiring proxy — and for which specific tools or categories. A signal without a defined trigger condition is just noise in a dashboard.
- Filter against your ICP before anything else. A tech stack change at a company outside your target headcount, industry, or geography isn't worth a rep's time. Qualify first, alert second.
- Stack the signal with a second data point. A tool change plus a recent funding round, a leadership hire, or engagement with relevant content is a materially stronger trigger than any single signal alone.
- Route the alert somewhere a rep will actually see it fast. A signal sitting in a weekly report is a signal you've already lost. Push it to Slack or your CRM the moment it fires.
- Personalize the first touch around the specific change, not the product category. "Congrats on the new stack" outreach reads as generic; referencing the specific transition reads as researched.
Speed matters here too, even if the classic proof point is dated. A widely-cited 2007 study by Dr. James Oldroyd, analyzing more than 15,000 web-generated leads, found contacting a lead within 5 minutes made reps 21 times more likely to qualify it than waiting 30 minutes. The exact multiplier is nearly two decades old and the tooling has changed since, but the underlying principle — speed compounds relevance — hasn't.
Steps 2 and 4 are where most technographic workflows break down in practice. The ICP Search filter reference covers every field available for qualifying an account before an alert goes out, and you can create a signal monitor that fires the moment a job change, engagement, or company event happens, instead of waiting for a scheduled report to catch it.
Where Technographic Data Falls Short (and How to Fix It)
Isn't it a little suspicious that every technographic vendor claims near-total coverage? Similarweb's technographic dataset tracks 8,000-plus technologies across more than 30 million companies (Similarweb, "Technographic Datasets," 2025-2026), but like most providers in this category, its detection method is website-scan-based — reading HTML, headers, and DNS records.
That approach has a structural blind spot: it can only see technology that touches a public-facing site. Backend systems — data warehouses, internal sales tools, ERPs, DevOps platforms — never show up in a scan because they're never exposed to a browser. A company could rip out its entire CRM and a scan-only provider wouldn't register a thing.
There's a freshness problem layered on top. Batch-refreshed technographic databases only update on whatever cycle the vendor runs — weekly, monthly, sometimes longer — which means the "live" data you're targeting could already be stale by the time a rep acts on it. If you're building outreach timing around a signal, the gap between when a change happens and when your system sees it is the whole game.
The practical fix is to stop treating technographic data as a standalone source and start layering it with signals that don't share the same blind spot: engagement activity, job changes, and funding events. None of those depend on a website scan, and combined with technographic data they cover both the "what tools does this company run" question and the "what's happening at this company right now" question.
In practice, that means pairing a technographic alert with a company engagement signal tracking real-time LinkedIn activity, or with funding round data as a budget-timing proxy — neither depends on a website scan, so both cover ground technographic data alone can't.
Real-World Playbooks: Stacking Technographic Signals With Other Triggers
Technographic data works best as one input in a stacked signal model, not as the whole strategy — and two existing playbooks show what that looks like in practice. The champion tracking playbook watches for job changes among known contacts, so if a champion who evaluated your category at their last company shows up somewhere new, that's a stack-change signal with a name and a relationship attached, not just a data point.
The competitor hijack approach does something similar from the other direction: it surfaces people engaging with a competitor's content, which often precedes — or directly follows — a tech stack decision. Combine that engagement signal with a detected tool removal at the same account, and you've got a far stronger trigger than either signal produces alone.
Neither of these replaces raw technographic monitoring. They extend it, closing the gap between "this company's stack changed" and "here's a specific, relevant reason to reach out to a specific person right now."
Both are documented as full playbooks: the champion tracking cookbook and the competitor hijack cookbook walk through the setup end to end.
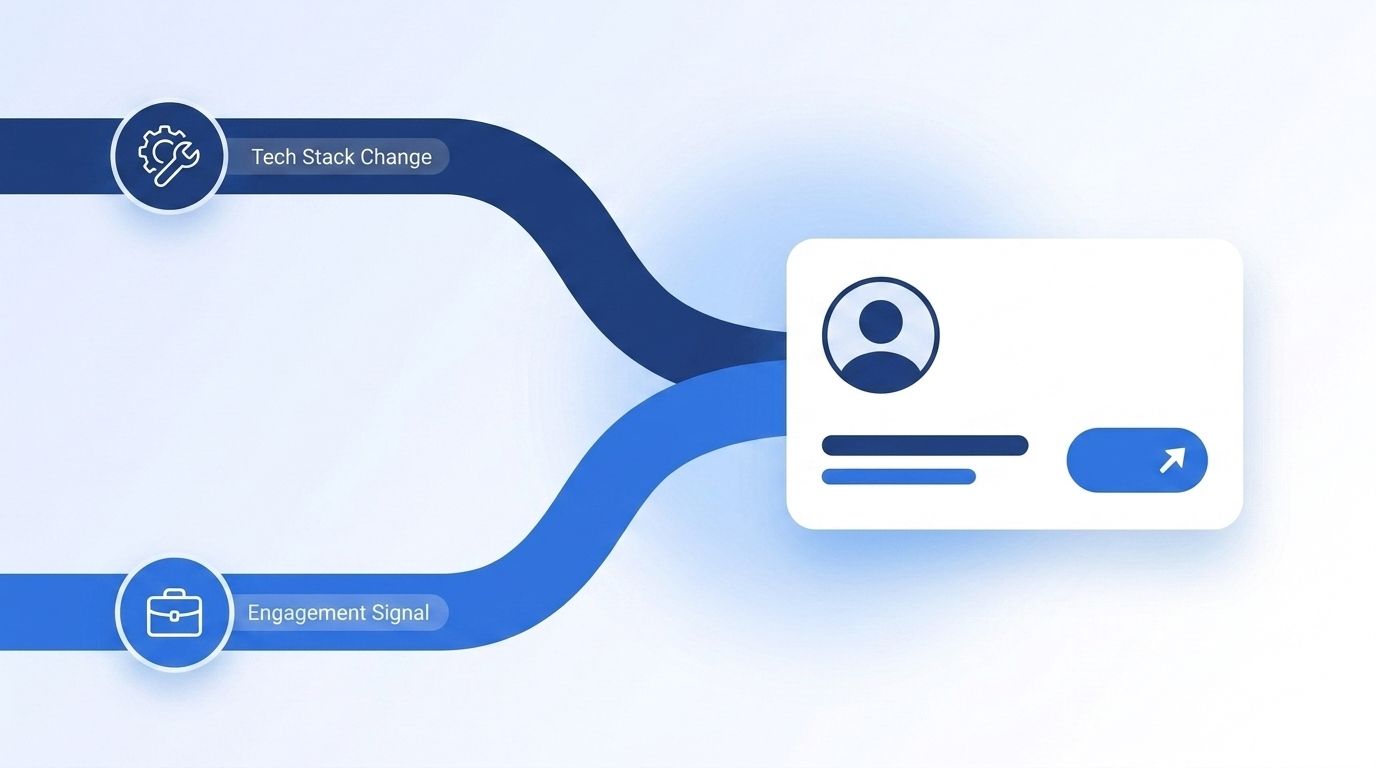
Datamagnet's own Signal API is built around this stacked-signal idea rather than pure website scanning — job change, engagement, and company-level events delivered through the same monitor so a rep isn't stitching together three separate tools to see the full picture. If you're comparing that approach to a database-style technographic vendor, see how it stacks up against ZoomInfo's model.
Frequently Asked Questions
What's the difference between technographic and firmographic data?
Firmographic data describes a company's static attributes — industry, headcount, revenue, location. Technographic data describes what software that company runs and when it changes. Firmographics tell you if a company fits your ICP; technographics tell you when something inside that company shifted enough to matter for timing.
How accurate is technographic data, really?
Vendor accuracy claims vary widely and are mostly self-reported — HG Insights claims 90% accuracy, for instance (HG Insights, 2025), but that figure isn't independently audited. Treat any single provider's number as a marketing claim, and cross-check technographic signals against a second data source, like engagement or job-change activity, before acting on them.
Can technographic signals detect internal or backend tools?
Mostly no. Website-scan-based providers like BuiltWith and Similarweb detect front-end technology — analytics tags, CMS platforms, ad pixels — because that's what's visible in public site code. Backend systems like CRMs, data warehouses, and internal sales tools require a different data source, such as job postings, contracts, or first-party integrations.
How fresh does technographic data need to be to be useful for outreach?
As fresh as you can get it. A widely-cited 2007 study found contacting a lead within 5 minutes made reps 21 times more likely to qualify it than waiting 30. That's an extreme case, but the direction holds: batch-refreshed data on a weekly or monthly cycle means you're often acting on a signal that's already gone cold.
Should I use technographic signals on their own, or combine them with other data?
Combine them. Technographic data alone tells you what a company runs; it doesn't tell you who to contact or why now, specifically. Layering in job-change, engagement, or funding signals closes that gap — and small, well-qualified outreach lists reply at 5.8% versus 2.1% for large, unqualified ones (Belkins, 2025), which is the practical payoff of stacking signals instead of blasting a raw list.
For a closer look at qualifying the people behind a triggered account, see Datamagnet's ICP People Search, which filters decision-makers by title, seniority, and company so your first touch reaches the right person, not just the right account.
Sources
- Zylo, "2026 SaaS Management Index," retrieved 2026-08-10, https://zylo.com/news/2026-saas-management-index
- BetterCloud, "The Number of SaaS Applications at Companies Declined for the First Time in Over a Decade" (2024 State of SaaSOps), retrieved 2026-08-10, https://www.prnewswire.com/news-releases/the-number-of-saas-applications-at-companies-declined-for-the-first-time-in-over-a-decade-302199899.html
- HG Insights, "Data Quality & Methodology," retrieved 2026-08-10, https://hginsights.com/hg-product-briefs/hg-insights-data-quality-methodology
- BuiltWith, "Market Analysis," retrieved 2026-08-10, https://builtwith.com/market-analysis
- Gartner, B2B buyer research on irrelevant outreach avoidance, retrieved 2026-08-10, https://www.gartner.com/en/newsroom/press-releases/2025-06-25-gartner-sales-survey-finds-61-percent-of-b2b-buyers-prefer-a-rep-free-buying-experience
- Belkins, 2025 B2B Cold Email Study (16.5M email dataset), retrieved 2026-08-10, https://flowstrata.com/blog/2026-05-11-b2b-cold-email-response-rates-in-2025-what-belkins
- Similarweb, "Technographic Datasets," retrieved 2026-08-10, https://www.similarweb.com/corp/daas/datasets/technologies/
