
Disclosure: Datamagnet publishes this article. Product capabilities described below are based on public documentation, retrieved 2026-07-20.
How to Run a RevOps Tech Stack Audit: A 2026 Step-by-Step Guide
In 2026, sellers use an average of 8 different tools just to close a single deal, and 42% say the tool count leaves them overwhelmed (Salesforce, State of Sales Report, 7th Edition, 2026). Overwhelmed reps are 45% less likely to hit quota. That's not a productivity problem you can coach your way out of - it's a stack problem.
Most RevOps teams already suspect they're carrying redundant tools. Few have actually mapped which ones overlap, which ones cover a gap nothing else fills, and which ones nobody's opened in 90 days. This guide walks through a 6-step audit that separates genuine coverage from expensive duplication, so you cut spend without breaking a single routing rule.
Key Takeaways
- The average RevOps/martech stack shrank from 62 tools in 2025 to 37 in 2026 (LeanData, B2B State of Martech & RevOps Report, 2026).
- Organizations manage an average of 305 SaaS applications, and up to 30% of IT budgets go to underutilized or redundant licenses (Zylo, 2026; Flexera, 2025).
- 84-85% of sales leaders plan to consolidate their tech stack within the next 12-24 months (Salesforce, 2026).
- 32% of RevOps teams report duplicate or mismatched lead-to-account records - a direct symptom of overlapping tools, not too few of them (LeanData, 2026).
- Cut tools by data domain, not by sticker price. Two enrichment tools covering the same 80% of accounts is waste; one intent tool covering a gap nothing else touches is coverage.
Why Does Your RevOps Stack Need an Audit Right Now?
The average organization now manages 305 SaaS applications, spending $55.7 million a year on software, and up to 30% of the typical IT budget goes to tools that sit underused or duplicate something else (Zylo, 2026 SaaS Management Index; Flexera, 2025 State of ITAM Report). That's the backdrop RevOps teams are auditing against, even if their own stack is a fraction of that size.
Here's the part that should worry you more than the dollar figure: 35% of IT and SaaS leaders say waste actually increased over the past year, despite having better tracking tools than ever (Flexera, 2025). Visibility isn't the bottleneck anymore. Discipline is. Teams can see the sprawl and still don't act on it, because nobody owns the decision to cut a tool a sales manager swears by.
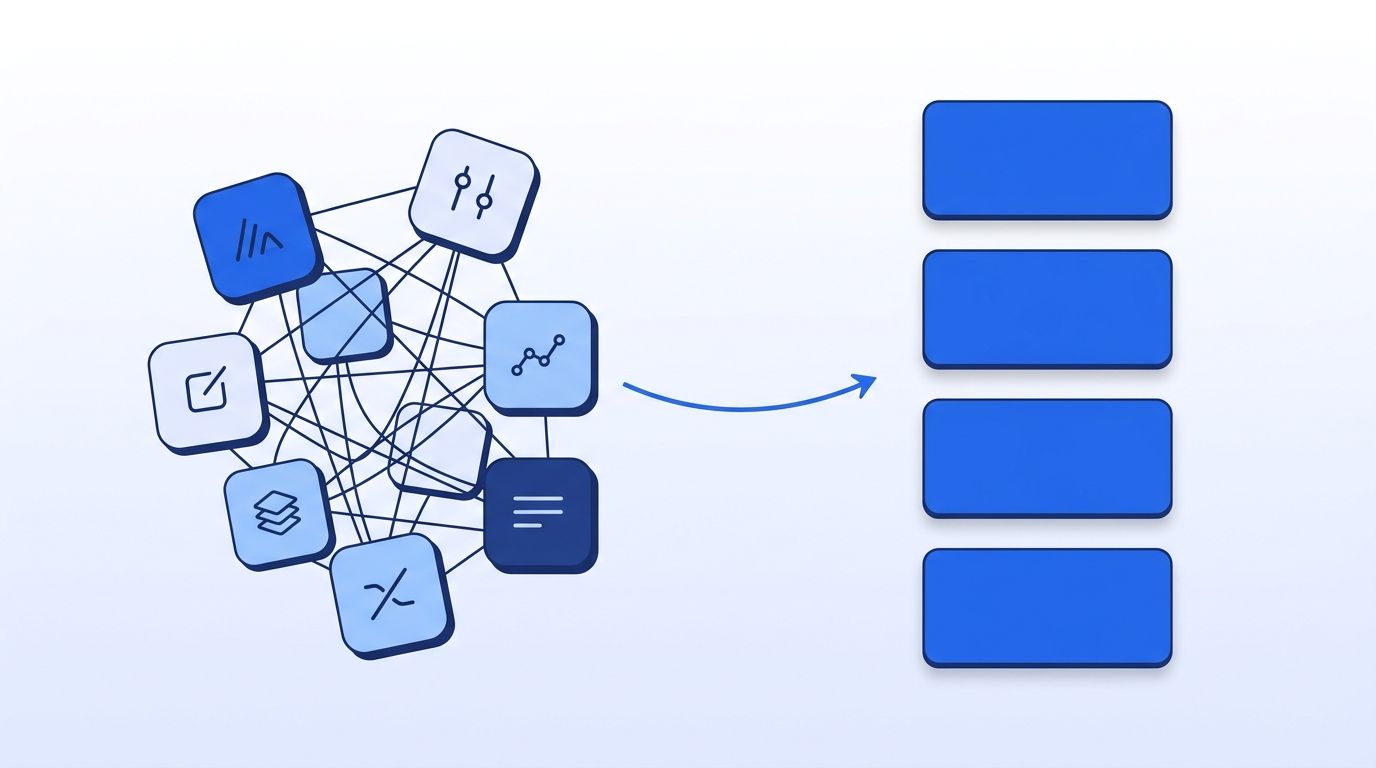
That's changing fast. RevOps stacks dropped from an average of 62 tools in 2025 to just 37 in 2026 - real, measured consolidation, not a survey wish-list (LeanData, B2B State of Martech & RevOps Report, 2026). And 84-85% of sales leaders say they plan to consolidate further over the next 12-24 months (Salesforce, 2026). If you haven't started your own audit, you're behind a trend that's already reshaping budgets around you.
Step 1: How Do You Inventory Every Tool Touching Revenue Data?
By the end of this step, you'll have a single master list of every tool that reads, writes, or routes revenue data, not just the ones on your own P&L line. Building it takes three cross-referenced sources: your SSO provider's app list, finance's software spend export, and your CRM's connected-apps panel, since redundant tools tend to hide in whichever one you check last.
Start with three sources: your SSO/identity provider's app list, your finance team's software spend export, and your CRM's connected-apps or marketplace panel. Cross-reference all three, because at least one tool always shows up in only one place - usually paid on a personal card or a team credit card nobody flagged.
For each tool, record who owns it, what data domain it touches (contact enrichment, intent signals, sales engagement, routing, reporting), the annual cost, and the last login date if your SSO provider tracks it. [UNIQUE INSIGHT] Don't skip the last-login field - a tool nobody's opened in 90 days is either dead weight or so deeply automated nobody needs to touch it, and you need to know which before Step 3.
If part of your stack includes API-based tools, check your actual usage against your plan the same way - for example, checking your API credit balance tells you whether a data API is running near capacity or sitting mostly idle, which matters just as much as a seat count for a per-seat SaaS tool.
Step 2: How Do You Map Tool Overlap by Data Domain?
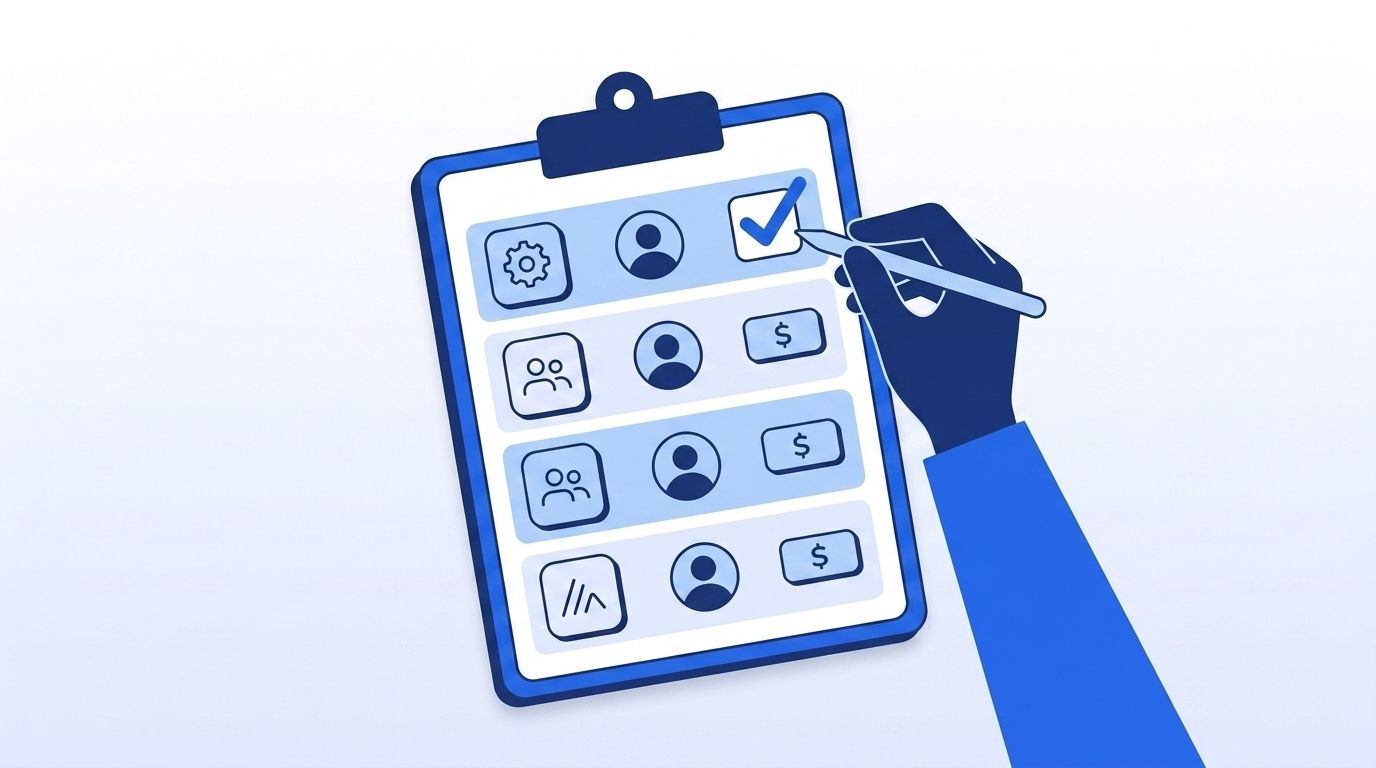
By the end of this step, you'll see exactly where two or more tools pay for the same coverage, which is the real definition of redundancy, not just "similar-sounding tools." You'll do this by grouping your Step 1 inventory into data domains such as contact enrichment, intent signals, and lead routing, since overlap almost always hides inside a single domain rather than across them.
Group your Step 1 inventory into data domains: contact enrichment, company/firmographic data, intent or buying signals, sales engagement, lead routing, and reporting. Most B2B teams end up paying for two or more tools inside the same domain - a contact-enrichment tool and a platform-enrichment tool that both return job title and company size for the same accounts, for instance.
That overlap has a measurable cost. 32% of RevOps teams report duplicate or mismatched lead-to-account records in their stack (LeanData, 2026) - a direct symptom of two systems writing conflicting values into the same field. When two enrichment sources disagree on a contact's current employer, your routing rules don't know which one to trust, and neither does the rep working the lead.
Enrichment tools in particular tend to cluster into overlapping tiers: contact-level tools, company/platform-level tools, and account-intelligence layers on top of both. Teams rarely audit across all three tiers at once, so they end up paying full price in each layer for data that two of the three already cover. Worth checking whether a comparison like Datamagnet vs. Clearbit or Datamagnet vs. ZoomInfo changes your view of which layer you actually need.
Step 3: How Do You Score Each Tool on Usage, Cost, and Data Quality Impact?
By the end of this step, every tool on your list will have a single audit score, not just a gut feeling about whether it's "worth it." That score comes from three weighted factors: usage over the last 90 days, fully-loaded cost, and data quality impact, so a cheap tool that's the only source for a field can outscore an expensive one that just duplicates another.
Score each tool across three factors: usage (active logins and API calls in the last 90 days), fully-loaded cost (license fee plus any per-record or per-credit charges), and data quality impact (does removing it create a gap, or just remove a duplicate?). Weight data quality impact the heaviest - a cheap, low-usage tool that's the only source for a specific field is more valuable than an expensive, heavily-used tool that duplicates three others.
Only 47% of RevOps professionals rate their stack's ROI as "average" or worse, and part of the reason is structural: in 60% of organizations, RevOps doesn't actually control its own tech budget (MarketingOps.com and Demand Metric, RevOps Tech Stack Research, 2025). If a sales manager or a regional VP bought a tool outside your budget line, your score sheet is also the document that finally puts it on the table for review.
If cost-per-record is part of your scoring model, comparing pay-as-you-go pricing against seat-based contracts is worth doing here - tools billed per active seat often cost more than their actual usage justifies once you've scored them against real login data.
Step 4: How Do You Identify Consolidation Candidates Without Losing Coverage?
By the end of this step, you'll have a short list of tools to cut, and just as important, a list of coverage gaps you're not allowed to introduce while cutting them. You'll build both lists by cross-referencing your Step 2 overlap map against your Step 3 scores, since a tool only qualifies as a real consolidation candidate when it scores low on usage and duplicates something else.
Cross-reference your Step 2 overlap map against your Step 3 scores. A tool is a strong consolidation candidate when it scores low on usage, duplicates a higher-scoring tool in the same data domain, and doesn't uniquely cover a field or account segment nothing else reaches. A tool is not a candidate just because it's expensive - expensive and irreplaceable is not the same problem as expensive and redundant.
Watch specifically for coverage gaps that don't show up until after handoff. 42% of RevOps teams cite poor sales-and-marketing alignment on lead qualification as a significant stack gap, and 29% say they lack visibility into what happens to a lead after it's routed (LeanData, 2026). Cutting a routing or attribution tool without checking whether it's the only thing feeding that post-handoff visibility is how a "savings" project turns into a pipeline blind spot.
For account-level data specifically, teams consolidating multiple point-tools sometimes replace them with a single filterable source - the ICP Company Search endpoint is one example of pulling industry, headcount, and technology filters from one API call instead of stitching together three separate exports.
Step 5: Pilot the Cut - Sunset in Stages, Not All at Once
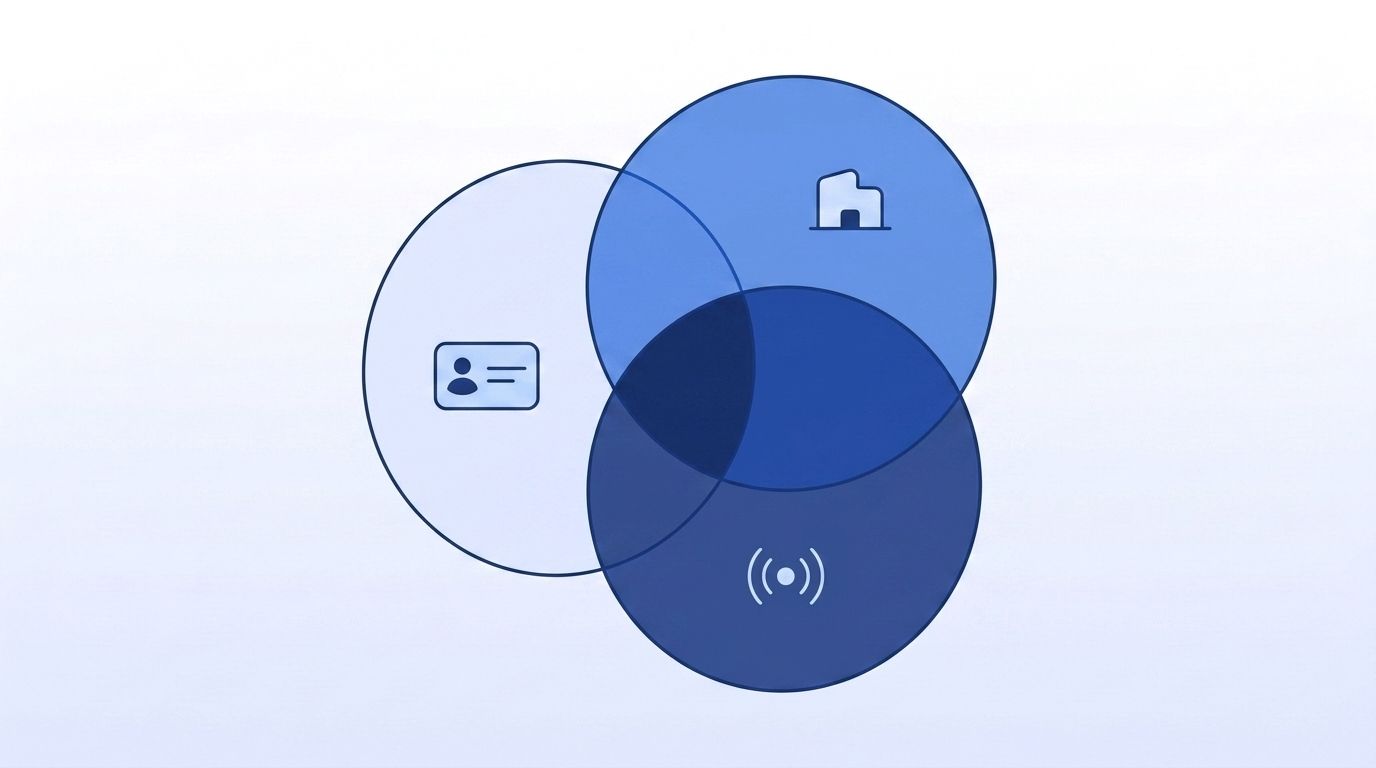
By the end of this step, you'll have retired your first tool with zero disruption to routing, reporting, or rep workflow, plus a repeatable process for the rest of your list. The method is simple but easy to skip under deadline pressure: run the old and new setup in parallel for two to four weeks and watch your Step 2 metrics for any regression before the sunset is final.
Never cut a tool cold on the same day across every team. Pick the lowest-risk candidate from Step 4, run both the old and new (or old and nothing) configuration in parallel for two to four weeks, and watch your Step 2 metrics - lead-to-account match rate, routing accuracy, report completeness - for any regression before you fully sunset it.
Isn't this exactly why the 60%-of-RevOps-doesn't-control-budget stat matters again here? Piloting in stages gives you a data-backed case to bring back to the stakeholder who bought the tool in the first place, instead of a unilateral cut that gets reversed the moment something looks slightly off in week one.
If you're replacing a legacy point tool with an API-based one during the pilot, the quickstart guide and the native HubSpot integration are both built to run alongside an existing CRM setup, so the parallel-run period doesn't require ripping anything out first.

Step 6: Rebuild Your Stack Map and Set a Recurring Audit Cadence
If everything went correctly, you should now have a documented, current stack map, a lower per-record and per-seat cost across your remaining tools, and zero regressions in routing accuracy or lead-to-account match rate from before the audit started. That map is the real deliverable, not the tool count.
An audit isn't a once-and-done project - the martech landscape itself grew to 15,384 total solutions across 49 categories in 2025, up 9% year over year (Chief Martec, 2025 Marketing Technology Landscape Supergraphic). New overlap gets created every time someone buys a tool to solve a problem your existing stack already solves.
Set a lightweight quarterly check (usage and cost review only) and a full re-audit annually. That cadence matters more in 2026 than it used to: 82% of RevOps leaders agree clean data and reliable routing must be in place before they can scale AI across the funnel, but only about 1 in 3 say they actually have the systems to support that today (LeanData, 2026). A stack full of quiet duplication is exactly what keeps that ratio stuck.
What Mistakes Should You Avoid When Auditing Your RevOps Stack?
Most failed stack audits don't fail on math, they fail on process. The same four mistakes show up again and again: cutting by price instead of by data domain, skipping the parallel-run pilot, treating the audit as a one-time project, and leaving the tool's actual budget owner out of the decision. Here's where teams lose the thread on each one.
1. Cutting by price tag instead of by data domain. Teams sort their tool list by annual cost and cut from the top, which almost always removes an irreplaceable tool while leaving two cheaper, fully redundant ones untouched. Score by overlap first, cost second.
2. Skipping the parallel-run pilot. [PERSONAL EXPERIENCE] Cutting a routing tool on a Friday and finding out Monday that leads stopped auto-assigning is a mistake every RevOps team makes exactly once. A two-to-four week parallel run costs a small amount of double-billing and saves you from finding gaps in production.
3. Treating the audit as a one-time project. With the martech landscape growing 9% a year in solution count (Chief Martec, 2025), a stack you cleaned up last year has almost certainly grown new overlap since. Build the quarterly check into your calendar now, not after the next round of sprawl.
4. Not looping in the tool's actual budget owner. In 60% of organizations, RevOps doesn't control its own tech budget (MarketingOps.com and Demand Metric, 2025). Cutting a tool without the person who approved it is how a "savings" decision gets quietly reversed three months later.
What Does Success Look Like After a Full RevOps Audit?
If you've completed all six steps, your stack should look like the industry benchmark that's already emerging: teams that audit and consolidate are converging toward roughly 37 tools, down from an average of 62 the year before (LeanData, 2026). Your specific number matters less than the trend line - fewer tools per data domain, higher usage per tool you kept, and a documented reason for every remaining license.
The stretch goal beyond a clean stack map: use the freed-up budget to consolidate your remaining data sources into fewer, more capable APIs rather than more point tools, which keeps the next audit smaller by default.
Programmatic CRM enrichment, explained walks through what that consolidation looks like in practice once your audit is done.
Frequently Asked Questions
How often should a RevOps team audit its tech stack?
Run a lightweight usage-and-cost check quarterly and a full overlap audit annually. The martech landscape grew 9% year over year in 2025 alone (Chief Martec, 2025), so a stack that's clean today accumulates new overlap faster than most teams expect.
What's the difference between tool consolidation and losing coverage?
Consolidation removes a tool that duplicates a data domain another tool already covers. Losing coverage removes the only source for a field, segment, or post-handoff signal. 29% of RevOps teams already report losing visibility after lead handoff (LeanData, 2026) - check your Step 2 overlap map before cutting anything to make sure you're not adding to that number.
How do I get stakeholder buy-in to cut a tool someone else champions?
Bring usage data, not opinions. In 60% of organizations, RevOps doesn't control its own tech budget, which means the person who bought the tool has to be part of the decision (MarketingOps.com and Demand Metric, 2025). A parallel-run pilot with hard match-rate numbers is far more persuasive than a cost spreadsheet alone.
Can I consolidate enrichment and intent tools into a single API?
Often, yes, for the domains where multiple tools return overlapping fields. the Datamagnet API documentation covers company, people, post, and signal endpoints in one authentication flow, which is a common target when teams are consolidating out of two or three separate enrichment contracts.
How much can a RevOps team realistically save by cutting redundant tools?
Up to 30% of the typical IT budget goes to underutilized or redundant software licenses (Flexera, 2025 State of ITAM Report). Your actual savings depend on how much overlap your Step 2 map turns up - teams with heavy enrichment-tool duplication tend to land toward the higher end of that range.
Get Started
A RevOps tech stack audit isn't a cost-cutting exercise dressed up as strategy - it's how you find out which of your 37-plus tools are actually earning their line item. Inventory first, map overlap by data domain, score honestly, and pilot every cut before it's permanent.
Ready to see how much of your enrichment and intent stack could run through a single API instead of three? Explore Datamagnet's solutions or check how account research infrastructure fits into your stack.
