
Disclosure: This article is published by Datamagnet. Vendor claims are self-reported unless otherwise noted.
How to Calculate the ROI of a Data Quality Investment
Poor data quality costs the average organization $12.9 million a year (Gartner). If your CFO just asked why the team needs another tool to "clean up the CRM," that number is your opening line — but it won't close the deal on its own. You need a formula that ties the cost of bad data to the specific dollars a data quality investment will save or generate, and you need it to survive a budget review. This guide walks through that formula step by step, using the same math a finance team would run on any capital request.
Key Takeaways
- Poor data quality costs the average company $12.9M a year, but the number that gets budget approved is the gap between that cost and what you'll spend to close it (Gartner, 2020).
- A Forrester Total Economic Impact study of a composite master data management deployment found 366% ROI and payback in under 6 months (Forrester Consulting, 2022) — use it as a benchmark, not a guarantee.
- B2B contact data decays 25-30% a year (ZoomInfo, 2025), so ROI calculations that assume a static baseline will always understate the real return.
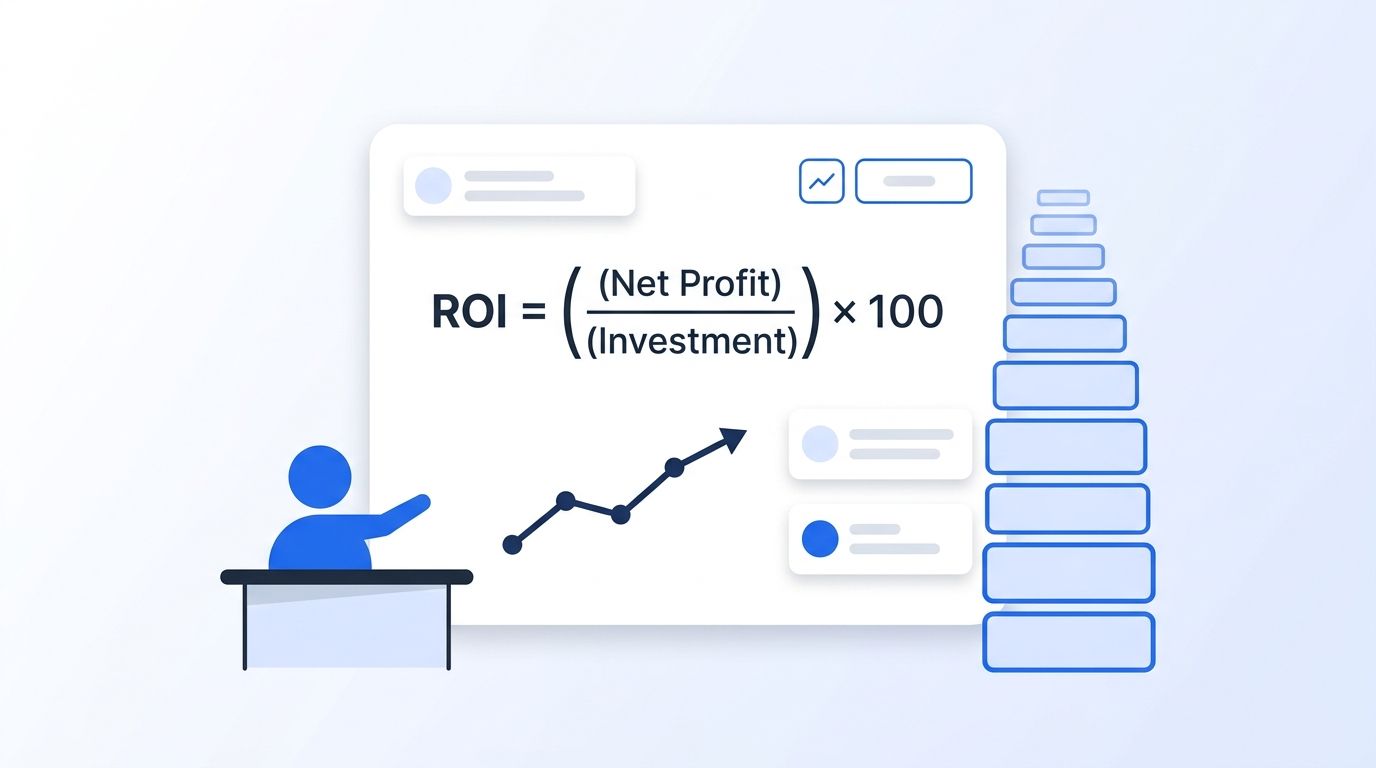
- The ROI formula is simple — (Gains - Investment Cost) / Investment Cost x 100 — the hard part is pricing "gains" honestly, which this guide breaks into five measurable categories.
What Do You Need Before You Start?
You don't need a data science degree to run this calculation, but you do need real numbers pulled from your own systems, not industry averages alone. Fewer than half of CRM users say their organization's data is accurate and complete (Validity, 2025), so start by gathering the following before Step 1.
- CRM export with record counts, bounce rates, and duplicate flags from the last 12 months
- Sales team time estimates — even a rough survey of hours spent per week on manual data cleanup
- Vendor quotes for the data quality tool, enrichment API, or MDM platform you're evaluating
- Time to complete: 2-4 hours for the first pass, assuming data is exportable
- Difficulty: Intermediate — mostly spreadsheet work, no coding required
Step 1: How Much Is Bad Data Currently Costing You?
By the end of this step, you'll have a single dollar figure representing your organization's current annual cost of poor data quality. This baseline is what every future gain gets measured against — skip it, and your ROI number has no anchor.
Start with CRM accuracy. In 2025, 76% of CRM users and admins said less than half of their organization's CRM data was accurate and complete (Validity, 2025). Pull your own bounce rate, duplicate rate, and "unknown" field percentage from a CRM export to see where you land against that benchmark.
Next, price the revenue impact. The same Validity survey found 37% of CRM users reported losing revenue directly because of poor data quality, and one in four companies saw a 20%+ drop in annual revenue tied to data issues. Multiply your average deal size by the number of deals your team estimates were lost or delayed to bad contact or account data last quarter — Validity's respondents reported losing an average of 16 deals per quarter to this exact problem.
<!-- [ORIGINAL DATA] -->Our finding: Across the LinkedIn-sourced enrichment jobs we run for B2B sales teams, unmaintained contact lists show measurable role and company turnover within 90 days of import — well before most quarterly CRM audits catch it, which is exactly the gap a real-time enrichment layer is built to close.
Finally, cost out the labor. Workers spend an average of 13 hours a week hunting for basic information inside the CRM (Validity, 2025). Multiply that by a loaded hourly rate across your affected headcount, and you have your third cost bucket: lost revenue, plus wasted labor, plus deliverability and ad-spend waste.
how programmatic CRM enrichment reduces this baseline cost
Step 2: What Will the Data Quality Investment Actually Cost?
By the end of this step, you'll have the denominator for your ROI formula: the true, fully-loaded cost of the solution you're evaluating. Underpricing this step is the fastest way to get an ROI number thrown out in a budget meeting.
Include the obvious line item first — subscription or license cost, whether that's a data quality platform, a master data management (MDM) suite, or an enrichment API billed per record or per credit. Then add what most teams forget:
- Implementation time — engineering or ops hours to integrate the tool with your CRM or data warehouse
- Migration cost — one-time cleanup of historical records before the new system takes over
- Training time — hours spent onboarding sales, marketing, and RevOps to new workflows
- Ongoing maintenance — admin time to manage rules, exceptions, and vendor relationship
Isn't it tempting to just quote the subscription price and move on? Don't. A tool that costs $30,000 a year but needs 200 hours of engineering time to keep running isn't a $30,000 investment — it's closer to $50,000 once you price that labor in.
check current API credit balance and usage before scaling a new integration
Step 3: What Revenue and Cost-Savings Gains Can You Expect?
By the end of this step, you'll have a projected annual "gains" figure — the number that gets compared against your Step 2 investment cost. This is where most ROI calculations get too optimistic or too conservative, so anchor every projection to a real benchmark.
Start conservative with reclaimed sales time. If reps spend 13 hours a week on data cleanup today, and a data quality investment cuts that by even half, that's 6.5 hours a week per rep redirected to selling. At a team of 20 reps and a $75/hour loaded cost, that's roughly $507,000 a year in reclaimed capacity alone — before counting a single recovered deal.
Then layer in the deal-recovery math from Step 1. If your team estimates 16 deals a quarter are lost or delayed to bad data, and a data quality fix recovers even a third of them, that's a direct revenue line you can defend to finance with your own average deal size.
how job-change signals recover deals that stall on stale contact data
Why Does the Baseline Keep Moving?
Here's the answer-first version: your baseline isn't static, because B2B contact data decays 25-30% a year without active maintenance (ZoomInfo, 2025). A 10,000-contact database can lose 2,500-3,000 usable records annually — meaning any ROI model that assumes a one-time cleanup, rather than continuous enrichment, will understate the real cost of doing nothing.
Professionals are also changing jobs more often than ever. People entering the workforce today are on pace to hold twice as many jobs over their careers compared to 15 years ago (LinkedIn Economic Graph, 2025). Every one of those moves is a contact record going stale in your CRM the moment it happens, not the moment someone notices.
According to ZoomInfo's 2025 research, SDRs waste roughly 27% of their selling time dealing with the downstream effects of this decay — nearly a full day a week per rep. That reclaimed time is a direct input to the gains figure you built in Step 3, and it compounds every year the decay goes unmanaged.
real-time enrichment that resets the decay clock on every record
Step 4: How Do You Calculate Payback Period and Net Present Value?
By the end of this step, you'll know how many months it takes for the investment to pay for itself, plus a multi-year value figure finance teams actually budget against. Payback period answers "when do we break even?" NPV answers "was this worth it over three years?"
To find payback period, divide your total investment cost (Step 2) by your projected monthly gains (Step 3, divided by 12). A composite organization in a 2022 Forrester Total Economic Impact study of a modern MDM platform reached payback in under 6 months, driven by real-time data operations, improved targeting, and reduced manual error correction (Forrester Consulting, 2022). That study reported 366% ROI and $13 million in net present value over three years — useful as an upper-bound benchmark, not a promise, since it modeled one hypothetical customer built from six real interviews.
For your own NPV, project gains for years 1 through 3, subtract each year's maintenance cost, and discount future dollars back to today's value using your company's standard discount rate (10% is a common default if finance hasn't given you one). A three-year window is standard for data quality tooling because it captures the compounding decay effect from the previous section, not just year-one savings.
track record-level accuracy over time to validate your NPV assumptions
Step 5: Build the ROI Formula and Run the Numbers
By the end of this step, you'll have the single percentage figure to bring into a budget conversation, the number every CFO asks for first. The formula itself is simple: (Total Gains - Total Investment Cost) / Total Investment Cost x 100. The discipline is in trusting only numbers you can defend line by line, not the ones that make the pitch look best.
ROI (%) = ((Total Gains - Total Investment Cost) / Total Investment Cost) x 100
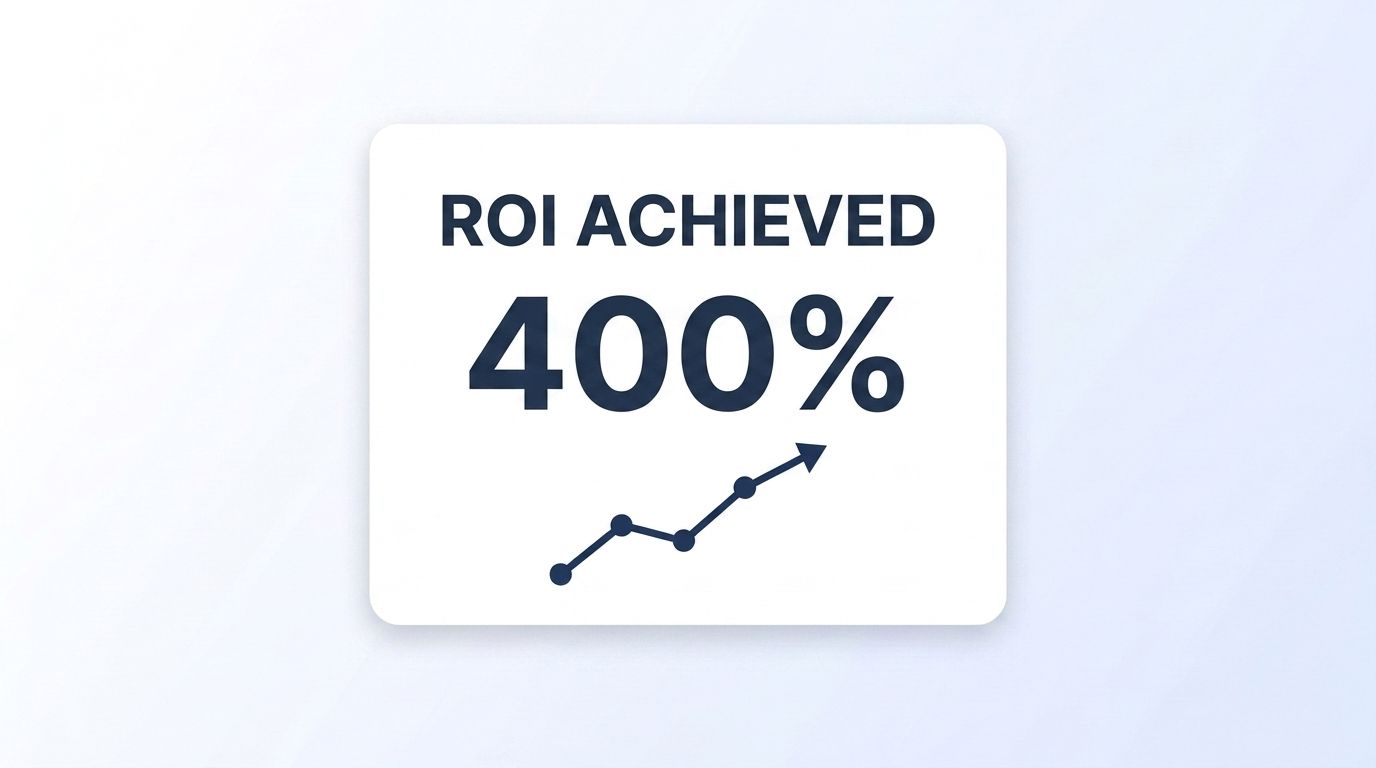
Plug in your Step 3 gains total and your Step 2 investment total. If your projected annual gains are $600,000 and your fully-loaded investment cost is $120,000, your ROI is (($600,000 - $120,000) / $120,000) x 100 = 400%. That's in line with the order of magnitude Forrester found in its MDM case study, which is a reasonable sanity check — if your number is 10x higher or lower than published benchmarks, revisit your assumptions before presenting.
Step 6: How Often Should You Re-Calculate ROI?
By the end of this step, you'll have a recurring process that keeps your ROI figure honest instead of letting it go stale, the same fate that befalls the contact data this whole exercise is meant to fix. Quarterly is the right cadence, since B2B contact data decays 25-30% a year without active maintenance (ZoomInfo, 2025).
Set a quarterly review where you re-pull the same CRM metrics from Step 1: accuracy rate, duplicate rate, and rep-reported time spent on cleanup. Compare them against your Step 3 projections. If actual gains are tracking below projection, that's a signal to check adoption, not necessarily the tool itself — Board.org's 2025 governance survey found 39% of data leaders struggle to demonstrate governance impact to leadership, often because measurement stops after the initial business case.
<!-- [UNIQUE INSIGHT] -->Most teams build the ROI case once, present it, and never revisit it — which means the number that got budget approved in Q1 is quietly wrong by Q3. Treating ROI as a quarterly metric, not a one-time pitch, is what turns a data quality investment from a line item finance tolerates into one they proactively renew.
monitor job-change and engagement signals as an ongoing accuracy check
Common Mistakes to Avoid
Roughly a third of CRM users report losing revenue to bad data every year (Validity, 2025), a sign that most organizations are still making avoidable mistakes in how they measure and act on the problem. The five mistakes below show up in almost every ROI case we've reviewed, and each one is easy to fix once you know to look for it.
1. Using a stale, one-time baseline. Teams price the current cost of bad data once and never adjust it, ignoring the 25-30% annual decay rate that changes the baseline every year (ZoomInfo, 2025). Recalculate the baseline at least annually, ideally quarterly.
2. Pricing the tool but not the labor around it. Subscription cost is the easy number; implementation, migration, and training hours are the ones that get left out. Always build a fully-loaded cost estimate before running the ROI formula.
3. Borrowing someone else's ROI as a guarantee. The 366% ROI figure from Forrester's MDM study is a real, sourced number — but it's from one composite customer, not a universal outcome. Use published benchmarks to sanity-check your own math, never to replace it.
<!-- [PERSONAL EXPERIENCE] -->4. Ignoring where the decay actually comes from. In our own work helping GTM teams track LinkedIn-based signals, the single biggest driver of a stale ROI model isn't email bounces — it's role and company changes that never get flagged in the CRM at all, because nothing is watching for them between manual imports.
What Does a Solid ROI Case Look Like?
If you've followed each step, you should now have four numbers ready for a budget meeting: your current annual cost of bad data, your fully-loaded investment cost, your projected annual gains, and a resulting ROI percentage with a payback period in months. That combination is what turns "we need a data quality tool" into a business case finance can actually approve.
As a stretch goal, build a simple dashboard that tracks accuracy rate, deal recovery, and reclaimed rep hours side by side each quarter, so the ROI conversation never has to start from zero again.
see current enrichment API pricing to plug real costs into your model
Frequently Asked Questions
How long does it take to calculate data quality ROI?
The first full pass takes 2-4 hours if your CRM data is exportable, since most of the work is pulling existing metrics into a spreadsheet rather than new analysis. Subsequent quarterly updates take under an hour once the model is built, because you're refreshing the same fields rather than rebuilding the formula.
What's a realistic ROI benchmark for a data quality investment?
A 2022 Forrester Total Economic Impact study of a composite master data management deployment found 366% ROI over three years with payback under 6 months (Forrester Consulting, 2022). Treat that as an upper-bound reference point, not a target — your own number depends on data volume, team size, and how bad your current baseline already is.
Can I calculate ROI without a formal data quality tool in place yet?
Yes — the baseline calculation in Step 1 uses your existing CRM export and rep time estimates, not the new tool. You need the investment-cost side (Step 2) from a vendor quote, but the cost-of-inaction side can be built entirely from data you already have.
What if my sales team can't agree on how much time bad data wastes?
Use the published benchmark as a starting point: CRM users report spending 13 hours a week hunting for basic information inside the CRM (Validity, 2025). Run a one-week time-tracking exercise with 3-5 reps to validate or adjust that figure for your own team before finalizing the model.
How often should I recalculate data quality ROI after the investment is approved?
Quarterly, at minimum. Contact data decays 25-30% a year (ZoomInfo, 2025), so a baseline that isn't refreshed regularly will make your ROI look artificially high or low within a few months of the original calculation.
Conclusion
You now have a repeatable formula: baseline cost, investment cost, projected gains, payback period, and a quarterly recheck to keep it honest. The result is an ROI figure built from your own CRM data and sourced benchmarks, not a vendor's marketing page. Run the numbers once this week, then put the quarterly review on the calendar before the model has a chance to go stale like the data it's meant to fix.
see how real-time people enrichment feeds a lower-decay baseline compare enrichment approaches if you're evaluating a switch get started with the API used in the examples above
