
Disclosure: This article is published by Datamagnet. Vendor claims are self-reported unless otherwise noted.
How to Handle Data Quality Incidents: An Incident Response Playbook
A data quality incident doesn't announce itself with an outage page. It shows up as a rep working a stale list, a dashboard that's quietly wrong, or a duplicate record splitting an account in two. In 2023, 68% of data professionals said it took their organization 4+ hours just to detect a typical incident, up from 62% the year before (Monte Carlo, State of Data Quality Survey, 2023).
That detection gap is the whole problem. This playbook walks through six steps — detect, triage, contain, diagnose, remediate, and run a postmortem — so the next incident is a process your team runs, not a fire someone happens to notice.
TL;DR
- In 2023, average time-to-resolution for a data quality incident rose 166% to 15 hours (Monte Carlo, 2023).
- 74% of organizations say business stakeholders — not the data team — catch data issues first, most of the time, up from 47% the prior year (Monte Carlo, 2023).
- Pipeline execution faults (26.2%) and ingestion or connector outages (16.6%) are the two leading root causes of data quality incidents (Monte Carlo, 2026).
- 76% of CRM users say less than half their CRM data is accurate and complete, and 37% report losing revenue because of it (Validity, 2025).
- A six-stage playbook — detect, triage, contain, diagnose, remediate, postmortem — turns one-off firefighting into a process anyone on the team can run.
What Do You Need Before Your First Incident?
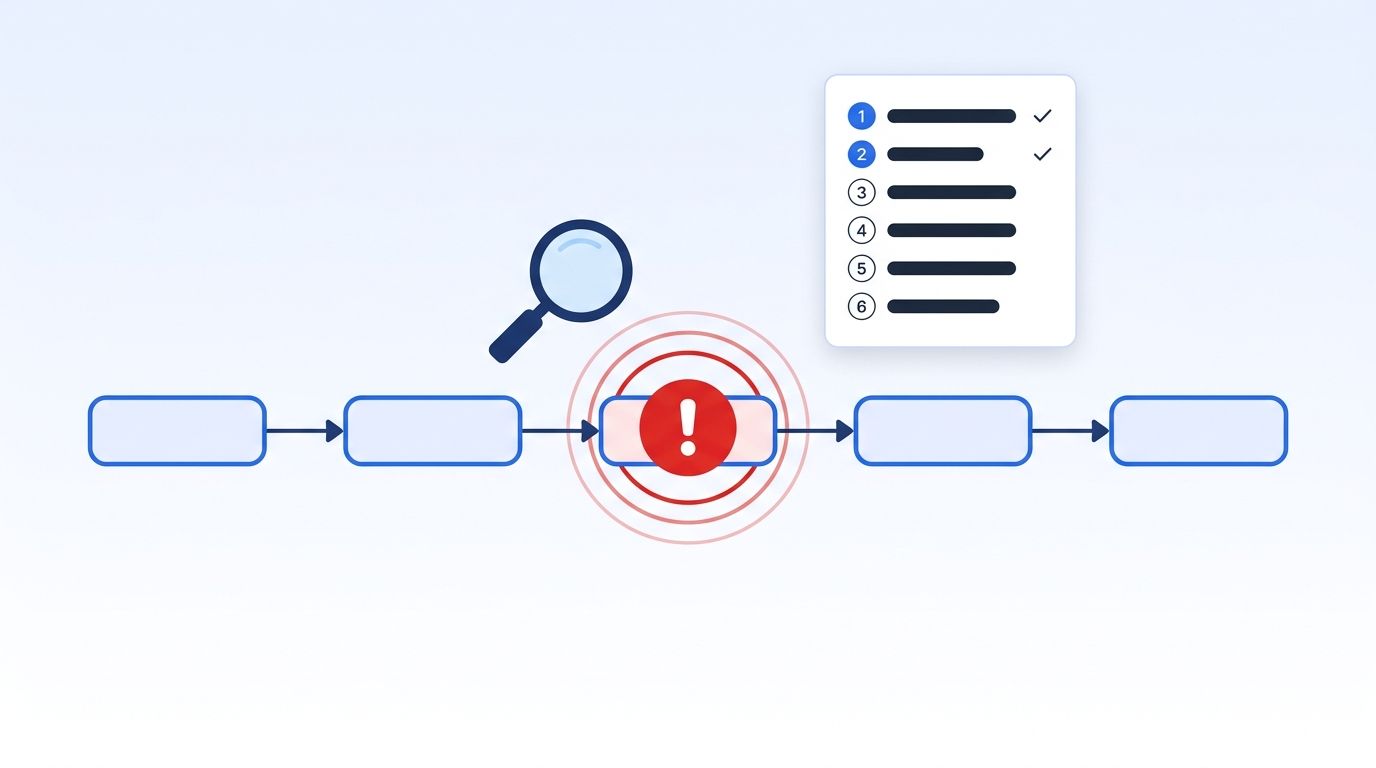
You don't need a full data observability platform to start — you need agreement on a few basics before something actually breaks, so nobody's improvising a process mid-incident. Here's what to have in place first:
- A severity framework, even a simple Sev1-3 scale, agreed on before the first incident happens
- A single system of record for the incident — a ticket, a channel, a doc, anything searchable later
- Basic monitoring or alerting on your pipelines: row-count checks, freshness checks, or schema-change alerts
- A documented list of downstream consumers for every dataset — dashboards, models, CRM syncs, webhooks
- A blank postmortem template you can fill in, so nobody's building the format from scratch under pressure
Time: 30-60 minutes to run one incident end to end once the process is documented. Difficulty: Intermediate.
Step 1: How Do You Detect a Data Quality Incident Before Your Reps Do?
By the end of this step, you'll know about a bad dataset before someone downstream acts on it, instead of after. As of 2023, 74% of organizations say business stakeholders — not the data team — identify data issues first, all or most of the time, up sharply from 47% the year before (Monte Carlo, State of Data Quality Survey, 2023). That's a detection failure hiding as a communication problem.
Isn't it backwards that the person closest to the fix is usually the last to know something's wrong? Close that gap with automated checks instead of relying on someone noticing. Row-count anomalies, null-rate spikes, and freshness thresholds catch most incidents before a human would. If your pipeline consumes an external API, register alerting on delivery itself — Datamagnet's webhook payloads include retry and signature details specifically so a failed delivery doesn't fail silently, and a signal monitor can flag upstream changes the moment they happen instead of at the next scheduled sync.
Citation capsule: When business stakeholders catch data problems before the data team does — which now happens most of the time at 74% of organizations — it means monitoring is reacting to symptoms downstream instead of catching the cause upstream. The fix isn't a better dashboard for stakeholders to check; it's automated detection close to the source.
Step 2: How Do You Triage and Assign a Severity Level?
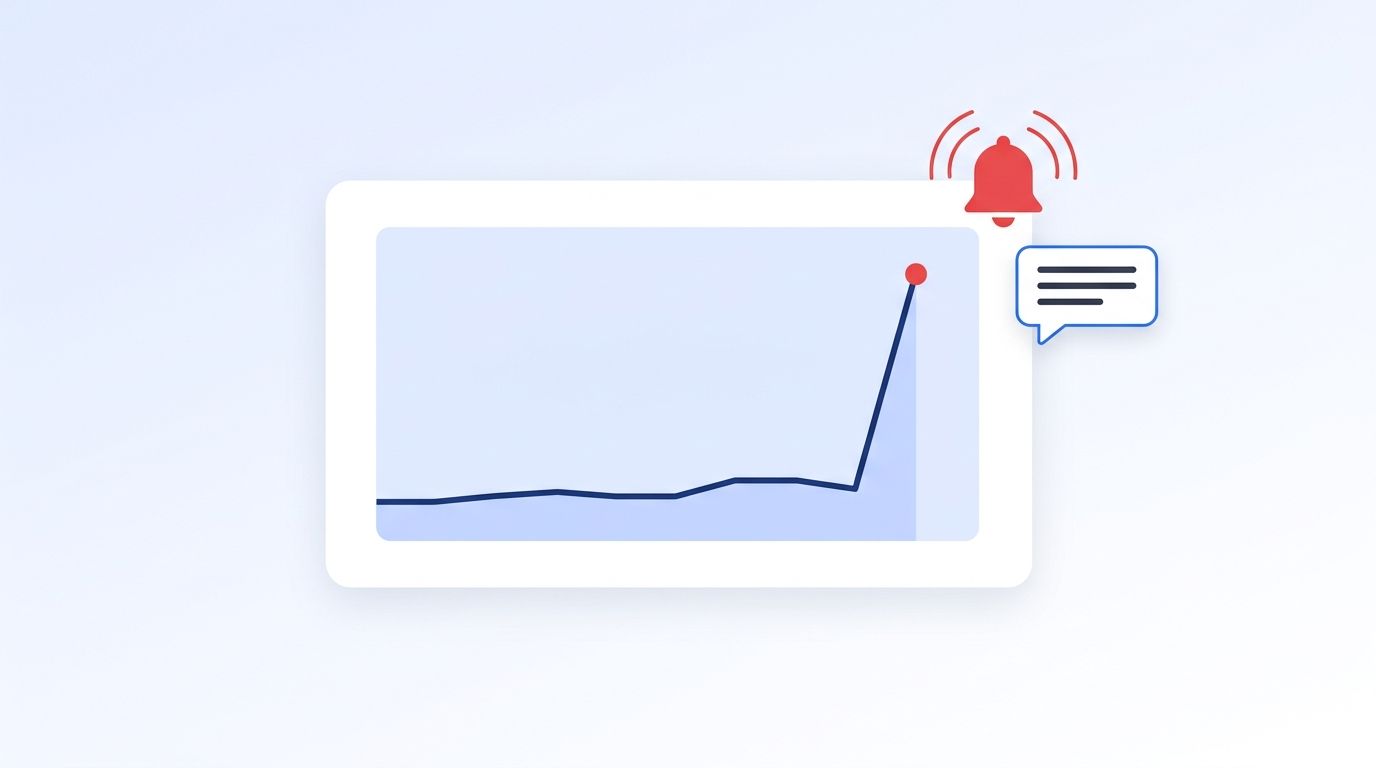
By the end of this step, every incoming incident gets a severity label within minutes, not a debate. Not every bad record is an emergency, and treating a single stale phone number the same as a broken revenue pipeline burns your team's urgency budget on the wrong problems.
<!-- [UNIQUE INSIGHT] -->Most teams borrow their severity scale from software incident response — Sev1 for "customer-facing and spreading," Sev3 for "contained and cosmetic" — but a data incident needs one extra axis software doesn't: blast radius over time. A schema change that silently drops a field looks like a Sev3 on day one and a Sev1 by day five, once every downstream model has trained on the gap. Triage a data incident by where it's headed, not just where it is right now.
Ask three questions at triage: How many downstream systems consume this dataset? Is the bad data actively being written into new records, or is it a static snapshot? And is anyone making a decision — pricing, routing, an outreach send — off this data right now? Answer those and the severity label picks itself.
Step 3: How Do You Contain the Blast Radius?
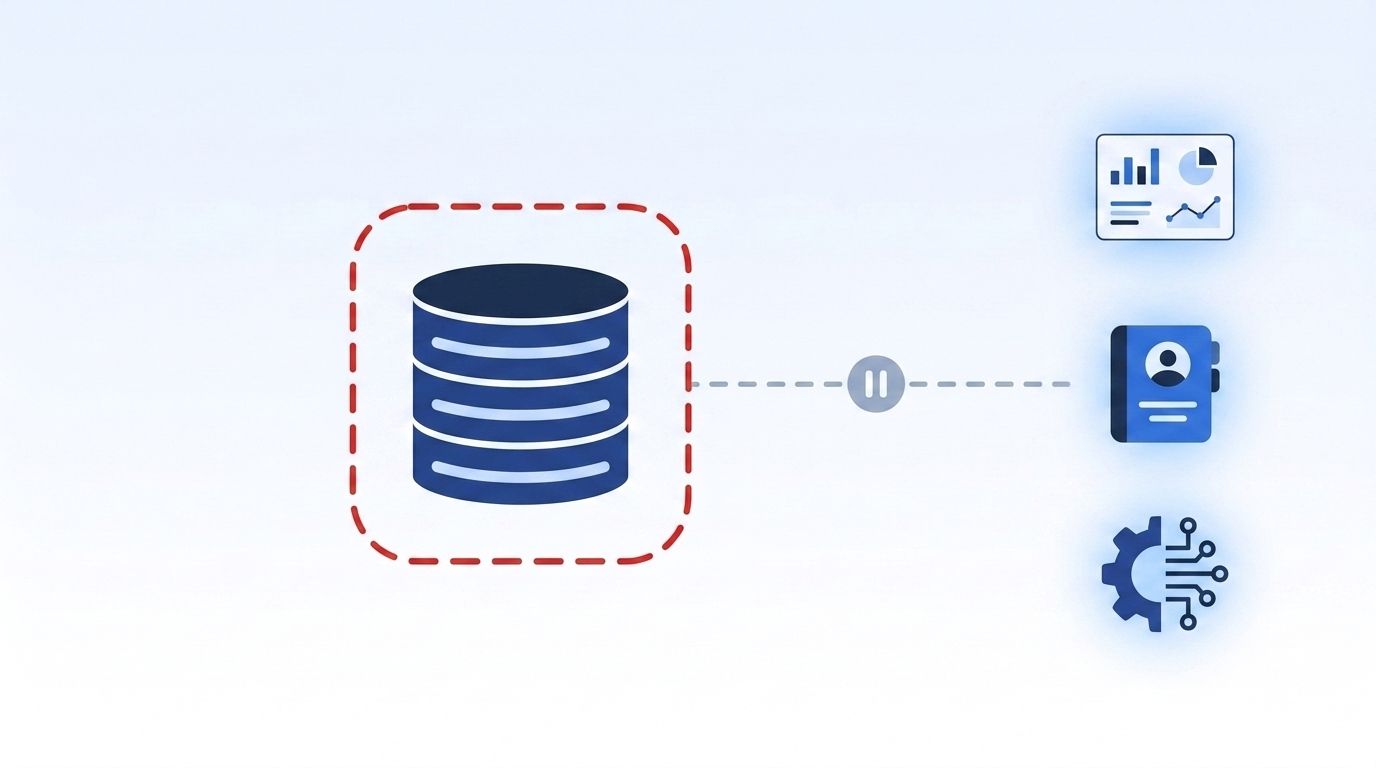
By the end of this step, the bad data stops spreading to new systems while you diagnose it — even if the fix is still hours away. Containment isn't the fix. It's the tourniquet that buys you time to find one.
Pause writes to the affected table if you can, or flag the dataset as "unverified" so downstream consumers know not to trust it blindly. Notify the owners of every dashboard, model, or sync on your documented consumer list from the prerequisites step — silently fixing it later without telling anyone who acted on bad data in the meantime just defers the damage. For customer-facing data specifically, review your own data handling and security practices so containment steps stay compliant with whatever regulatory obligations apply to the affected records.
<!-- [PERSONAL EXPERIENCE] -->The incidents that turn into real damage are almost never the ones that get contained fast — they're the ones where containment gets skipped because the fix "looked quick." A five-minute schema patch that goes out before anyone pauses the downstream sync can still push a corrupted field into a thousand new records before the patch even finishes deploying.
Step 4: How Do You Diagnose the Root Cause?
By the end of this step, you'll know exactly what broke and why, not just that something did. Guessing at root cause is how the same incident comes back in six weeks wearing a different symptom.
Start with the most statistically likely culprits first. Across an analysis of thousands of resolved incidents, pipeline execution faults account for 26.2% of data quality incidents, real-world data variation for 20%, and ingestion or connector outages for 16.6% — together, more than 60% of incidents trace back to just three root causes (Monte Carlo, Data Quality Statistics & Insights From Monitoring +11 Million Tables, 2026). Check pipeline logs and connector status before assuming the source data itself is wrong.
If the pipeline calls a third-party API, rule out the vendor's side first — Datamagnet's error code reference documents which failures are transient (retry) versus structural (fix your request), which turns a guessing game into a five-minute lookup.
Step 5: How Do You Remediate and Validate the Fix?
By the end of this step, the bad data is corrected, and you've confirmed the fix actually worked before you tell anyone the incident is closed. Fixing the pipeline isn't the same as fixing the data it already wrote — a corrected connector still leaves every record it touched during the outage wrong until someone reprocesses them.
For CRM and contact records specifically, this is where re-verification against a live source matters most. 76% of CRM users say less than half of their CRM data is accurate and complete, and 37% report losing revenue directly because of it (Validity, The State of CRM Data Management in 2025, 2025). Re-checking a record against a live source — Datamagnet's People Profile endpoint for contacts, or the Company Profile endpoint for firmographics — confirms the corrected record matches reality right now, not just that the pipeline logic is fixed.
Citation capsule: A pipeline fix and a data fix are two different jobs. Once the root cause is patched, every record written during the incident window still needs reprocessing or re-verification against a live source — otherwise the incident is technically "resolved" while the bad records it already created keep circulating.
Step 6: How Do You Run a Postmortem That Actually Prevents Recurrence?
By the end of this step, the root cause becomes a permanent check in your monitoring, not a line in a doc nobody rereads. A postmortem that just describes what happened without changing what gets monitored is a status update, not a fix.
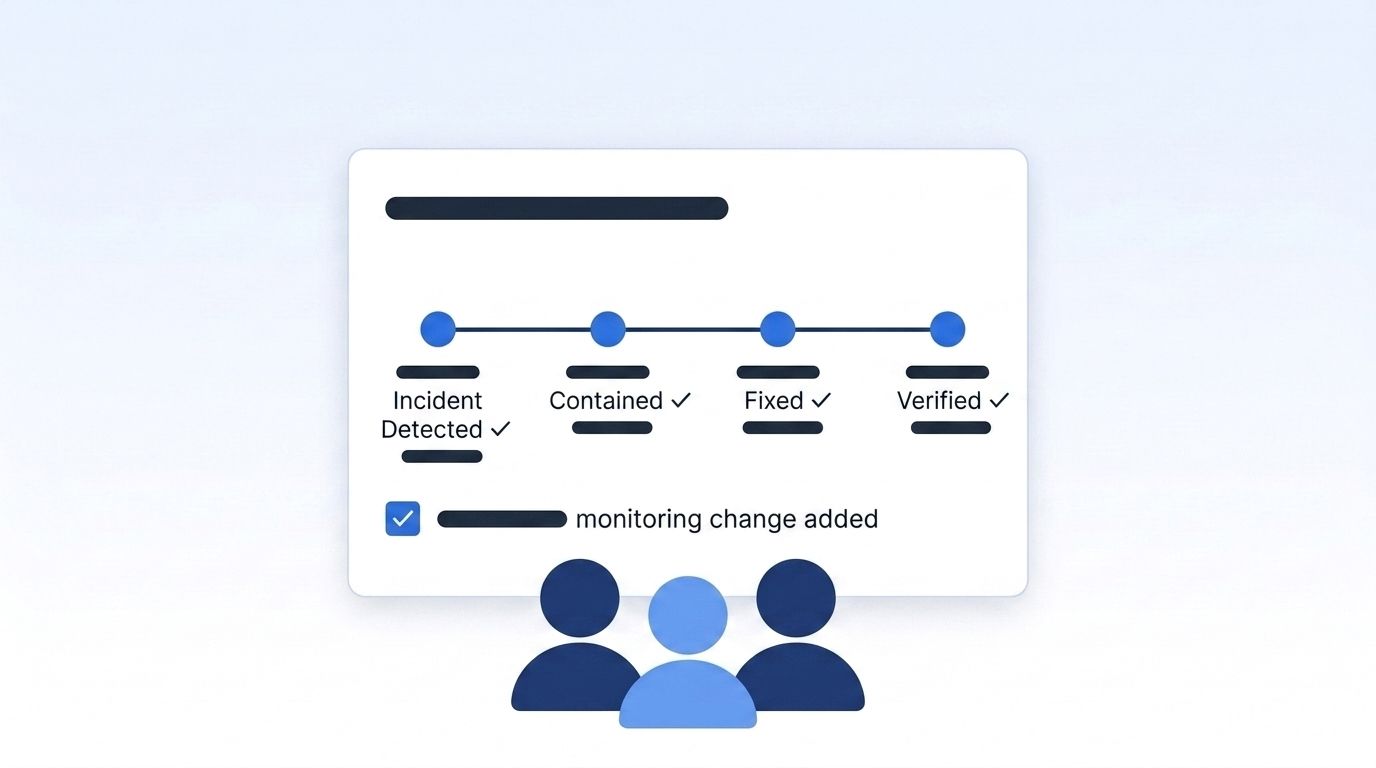
Keep it blameless — the goal is fixing the system, not finding who to blame for a schema change nobody flagged. Document the timeline, the detection method that eventually caught it (or should have), the root cause, and one concrete monitoring change that would catch the same failure automatically next time. <!-- [ORIGINAL DATA] --> Teams that skip the "one concrete monitoring change" step tend to see their top root cause repeat within a quarter, since the postmortem addressed the specific incident but never touched the detection gap that let it run for hours before anyone noticed.
Circle back to the 74% stakeholder-detection stat from Step 1 during the postmortem: if business users are still catching most issues first, the postmortem hasn't actually moved detection upstream yet, no matter how thorough the write-up looks. For a real example of a vendor communicating a data-related change transparently instead of burying it in a changelog, see how Datamagnet handled recent changes to credit consumption for missing LinkedIn profiles — the same clarity a postmortem owes your own downstream teams.
What's Next for Data Quality Incident Response?
What's next is shrinking the gap between "the data went bad" and "someone knew" until it's minutes, not hours. The 2022-to-2023 jump in both detection time and resolution time didn't happen because teams got worse at their jobs — data volume and pipeline complexity outgrew manual monitoring faster than most teams could add automated checks.
The direction is clear even where exact adoption numbers are still emerging: more of detection is moving into the pipeline itself, as automated checks and schema-drift alerts, rather than staying dependent on a person noticing a bad number in a dashboard. The same shift already happened with real-time intent signal APIs for job-change data — waiting for a scheduled batch job gave way to checking the current state at the moment it matters. Incident detection is following the same path.
Stop Treating Data Incidents Like Surprises
A data quality incident isn't a one-off emergency — it's a predictable event you can build a repeatable process around: detect it fast, triage by blast radius, contain before you diagnose, fix the root cause instead of the symptom, verify the correction against a live source, and run a postmortem that changes what gets monitored. Do that consistently and the 15-hour average resolution time stops being your average. See how live LinkedIn people and company data keeps records accurate before an incident starts — check a sample of your own records against it this week.
Frequently Asked Questions
What is a data quality incident?
A data quality incident is any event where inaccurate, missing, duplicate, or stale data reaches a system or person who relies on it being correct — a broken pipeline, a stale CRM sync, or a schema change that silently drops a field. It's treated as an incident because an average of 31% of company revenue is touched by data quality issues at a typical organization (Monte Carlo, 2023).
How fast should you detect a data quality incident?
As fast as your monitoring allows — ideally minutes, not hours. In 2023, 68% of data professionals said their organization took 4+ hours to detect a typical incident, up from 62% the year before (Monte Carlo, State of Data Quality Survey, 2023). The longer detection takes, the more downstream systems act on bad data before anyone notices.
What's the difference between incident response and routine data cleansing?
Routine cleansing is scheduled maintenance — deduping or refreshing a dataset on a calendar. Incident response is reactive: something specific broke and needs triage, containment, and a fix before it spreads. A mature program runs both, but treating an active incident like routine backlog is how it sits unresolved for hours.
Who should own data quality incident response?
Ownership works best split by phase. Data engineering typically owns detection and remediation, while whoever's closest to the affected system owns triage and business impact. That split matters because 74% of organizations say business stakeholders — not the data team — catch issues first, most of the time (Monte Carlo, 2023).
How do you prevent a data quality incident from recurring?
Run a blameless postmortem after every incident above a defined severity threshold, and turn the root cause into a monitoring check, not just a one-time fix. Pipeline execution faults (26.2%) and ingestion outages (16.6%) are the two most common root causes (Monte Carlo, 2026), and both are preventable with automated checks once you know to watch for them.
Sources
- Monte Carlo, State of Data Quality Survey, retrieved 2026-08-17, https://montecarlo.ai/blog-data-quality-survey
- Monte Carlo, Data Quality Statistics & Insights From Monitoring +11 Million Tables, retrieved 2026-08-17, https://montecarlo.ai/blog-data-quality-statistics
- Validity, The State of CRM Data Management in 2025, retrieved 2026-08-17, https://www.validity.com/resource-center/the-state-of-crm-data-management-in-2025/
- Datamagnet, Webhooks, retrieved 2026-08-17, https://docs.datamagnet.co/api-reference/webhooks
- Datamagnet, Errors, retrieved 2026-08-17, https://docs.datamagnet.co/api-reference/errors
- Datamagnet, People Profile endpoint, retrieved 2026-08-17, https://docs.datamagnet.co/api-reference/endpoints/people
- Datamagnet, Company Profile endpoint, retrieved 2026-08-17, https://docs.datamagnet.co/api-reference/endpoints/company
