
Disclosure: Datamagnet publishes this article. Product capabilities described below are based on public documentation, retrieved 2026-08-17.
The Data Quality Maturity Model: Where Does Your Team Rank?
Poor data quality costs the average organization $12.9 million a year in wasted spend, missed pipeline, and rework (Gartner, 2021, still cited industry-wide in 2026). Most teams know their data has problems. Far fewer can tell you exactly how mature their data quality program actually is, or what the next step up looks like.
A data quality maturity model fixes that. It's a structured way to score where your team stands today, across the dimensions that actually predict clean data, and get a concrete plan to move up one level. This guide walks through a 5-stage model, gives you a scorecard to rank your own team, and shows you how to build a 90-day roadmap out of whatever stage you land on.
Key Takeaways
- Poor data quality costs the average organization $12.9 million a year (Gartner, 2021).
- Only 7% of enterprises say their data is completely ready for AI, and 27% say it's not ready at all (Cloudera + Harvard Business Review Analytic Services, March 2026).
- Score your team across 5 dimensions - ownership, standards, monitoring, tooling, and culture - to find your current maturity stage.
- Moving up one stage is a 90-day project, not a multi-year overhaul, if you fix the single weakest dimension first.
- 37% of CRM users have already lost revenue directly tied to bad data (Validity, July 2025) - waiting to start costs more than the assessment itself.
What Is a Data Quality Maturity Model?
A data quality maturity model is a framework that ranks how systematically an organization manages, monitors, and improves its data - from ad hoc firefighting at the bottom to continuous, automated quality control at the top. It borrows its structure from CMMI-style capability models and overlaps heavily with the governance frameworks in DAMA-DMBOK, the most widely adopted data governance standard in the industry.
Think of it less like a certification and more like a fitness test. It doesn't hand you a trophy. It tells you, specifically, which muscle is weakest so you know what to train next. Among organizations that have adopted a formal data governance framework, 46.6% use DAMA-DMBOK and 41.7% use DCAM, while a full 31% still run on no formal framework at all (Tony Mazzarella, PhD, April 2025, n=341 data governance professionals).
<!-- [UNIQUE INSIGHT] -->Most maturity conversations stall because teams try to rank the whole organization at once. That's the wrong altitude. A company can be advanced in data security and still be stuck at "ad hoc" for CRM contact data, because maturity isn't one number - it's a profile across dimensions that move independently. Score the dimensions separately, and the plan writes itself.
For teams building on top of live LinkedIn data, the Datamagnet API documentation lays out the endpoints and quotas you'd map against each dimension below - useful context before you start scoring.
What Are the 5 Stages of Data Quality Maturity?
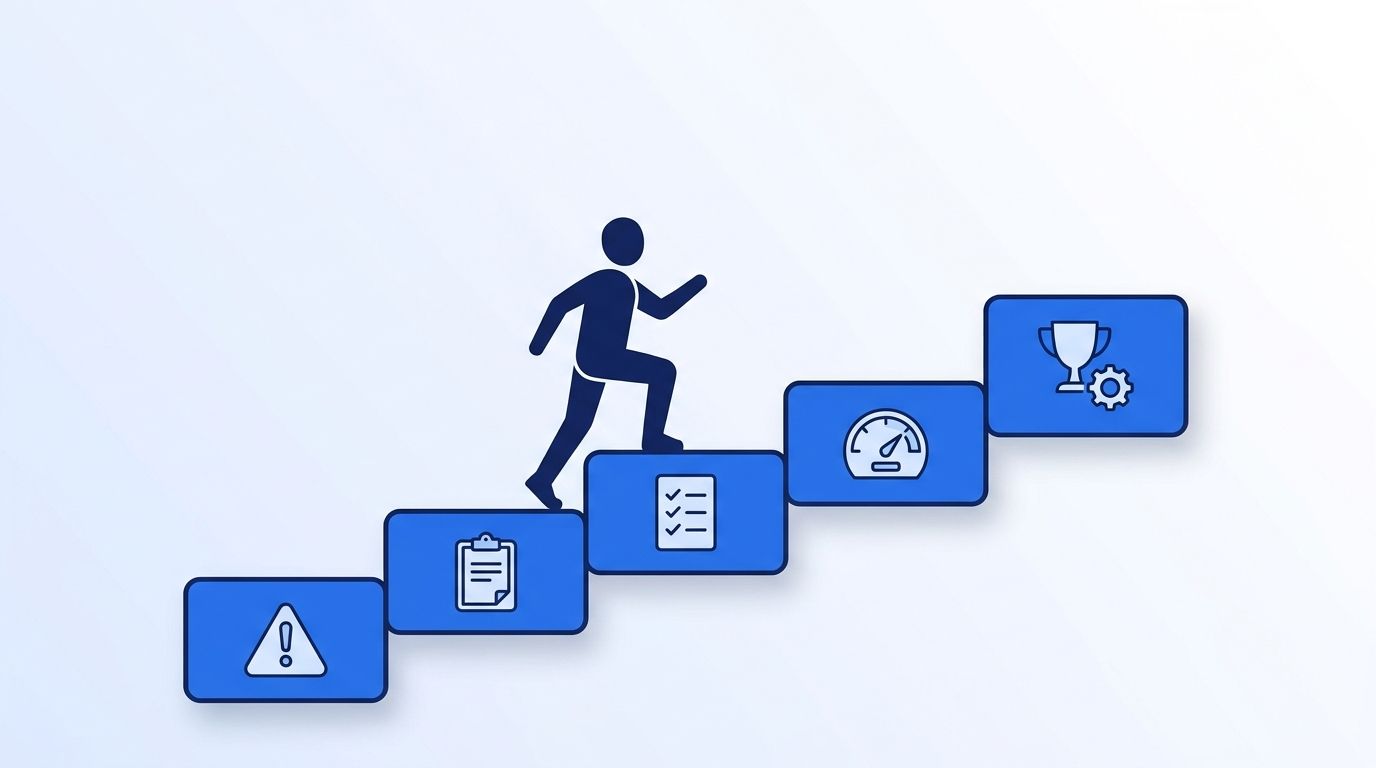
Every maturity model uses slightly different labels, but the underlying progression is consistent across CMMI-based frameworks and DAMA-DMBOK's governance maturity guidance. Here's the version we use, with what each stage actually looks like day to day, from firefighting at the bottom to fully automated quality control at the top. The table below breaks down all five.
| Stage | Name | What It Looks Like |
|---|---|---|
| 1 | Ad Hoc | No owner, no standards. Data gets fixed only when something breaks visibly. |
| 2 | Managed | Someone owns data quality part-time. Cleanup happens, but reactively and inconsistently. |
| 3 | Defined | Written standards exist (field formats, dedup rules, source-of-truth policy) and most of the team follows them. |
| 4 | Quantitatively Managed | Data quality is measured with real metrics - accuracy rate, decay rate, duplicate rate - tracked on a recurring cadence. |
| 5 | Optimized | Monitoring and correction are automated. Records refresh continuously instead of waiting for the next cleanup cycle. |
Where does most of the market actually sit? Hard survey data on stage-by-stage distribution is thin, but the surrounding signals aren't encouraging: only 11% of organizations report high metadata management maturity, and just 4% have high maturity in both data governance and AI governance simultaneously (DATAVERSITY, 2025-2026 industry survey coverage). If that sounds like your team, you're in good company - most teams are.
Step 1: Score Your Team Across 5 Dimensions
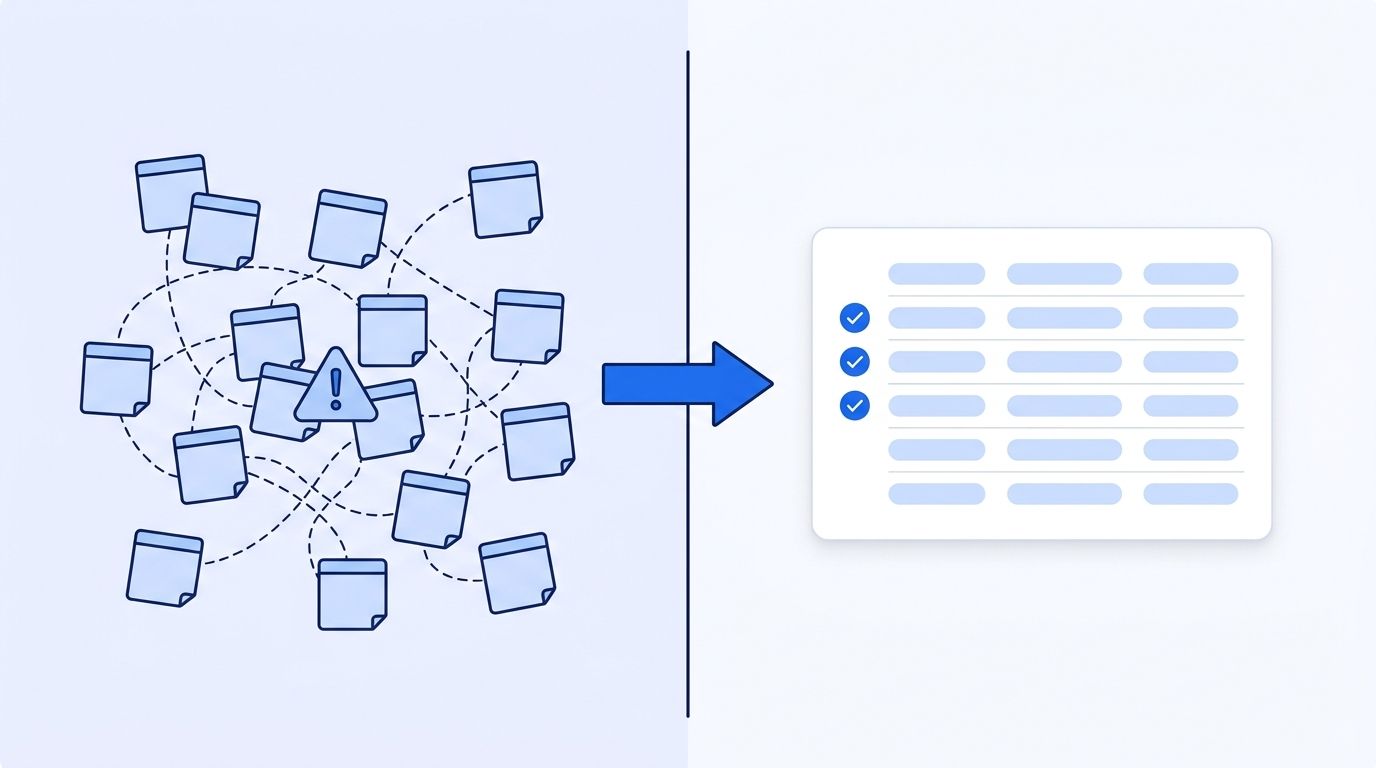
By the end of this step, you'll have a number for each of the five dimensions that drive data quality maturity, not just a gut feeling. Rate your team 1 to 5 on each dimension below, where 1 matches Stage 1 (Ad Hoc) and 5 matches Stage 5 (Optimized).
- Ownership & Governance - Is there a named owner for data quality, with real authority to enforce standards? Or does everyone assume it's "someone else's job"?
- Standards & Definitions - Are field formats, naming conventions, and source-of-truth rules written down anywhere, or do they live in one person's head?
- Monitoring & Measurement - Do you track accuracy, decay, and duplicate rates as actual metrics, or only notice problems when a rep complains?
- Tooling & Automation - Is cleanup manual and spreadsheet-driven, or does software catch and fix errors before a human sees them?
- Culture & Accountability - Do reps and marketers treat bad data as everyone's problem, or as the data team's problem to clean up later?
In conversations with GTM teams evaluating enrichment vendors, the dimension that lags furthest behind the other four is almost always Monitoring & Measurement - teams have an owner and some standards, but no recurring number that tells them whether data quality is getting better or worse month over month.
Step 2: Add Up Your Score and Find Your Stage
Add your five dimension scores together, using the 1-to-5 ratings you just gave each one in Step 1. The total, out of 25, maps directly to your overall maturity stage. Match it against the five ranges below to see exactly where your team lands today, and how far the next stage actually is:
- 5-8: Stage 1, Ad Hoc - You're firefighting, not managing.
- 9-13: Stage 2, Managed - Someone's responsible, but the process is still reactive.
- 14-18: Stage 3, Defined - Standards exist and mostly hold, but nothing's measured consistently.
- 19-22: Stage 4, Quantitatively Managed - You track real metrics and can prove whether you're improving.
- 23-25: Stage 5, Optimized - Monitoring and correction happen automatically, continuously.
A single total score is useful for a headline number, but it hides the real story. Two teams can both land at "14 out of 25" with completely different profiles - one weak across the board, one excellent on governance and dead last on monitoring. That's why Step 3 matters more than the total.
Step 3: Which Dimension Is Holding You Back?
Look at your five individual scores side by side, not the sum. The lowest-scoring dimension is your bottleneck, and it's usually the one worth fixing first, because a weak dimension tends to cap what the others can achieve. Governance without monitoring just means well-intentioned rules nobody can verify are working.
This pattern shows up clearly in the AI data readiness numbers. Gartner predicts organizations will abandon 60% of AI projects by 2026 that lack AI-ready data, and a separate Gartner survey found 63% of data management leaders either lack, or aren't sure they have, the right practices to support AI initiatives (Gartner Newsroom, February 2025). In nearly every case, the failure traces back to one weak dimension, not a total absence of data discipline.
Citation capsule: A data quality maturity model isn't about hitting a perfect score across every dimension at once - it's about identifying the single weakest link, since governance, monitoring, and tooling compound each other and a gap in one caps what the rest can deliver.
Step 4: Build a 90-Day Plan to Move Up One Stage
You don't need a multi-year transformation program to move up a stage. You need a focused 90-day plan built around your single weakest dimension, broken into four two-to-three-week phases below, with one clear metric at the end that proves whether the fix actually worked in practice.
- Weeks 1-2: Baseline the weak dimension. If Monitoring is your gap, pull your current accuracy, duplicate, and decay rates - even roughly - so you have a "before" number.
- Weeks 3-6: Write the standard or pick the tool. If Standards is your gap, document field formats and source-of-truth rules. If Tooling is your gap, evaluate options that check data at the point of use rather than on a quarterly schedule.
- Weeks 7-10: Roll it out to one team or one data object first. Prove the fix on your highest-value CRM object - usually company or contact records - before rolling it out everywhere.
- Weeks 11-13: Re-measure and report the delta. Show the "before" and "after" number to whoever owns the budget. This is what turns a data quality project into an ongoing line item instead of a one-off scramble.
Prioritize whichever dimension touches revenue fastest. 37% of CRM users report losing revenue directly tied to poor data quality, and 76% say less than half their CRM data is accurate and complete (Validity, State of CRM Data Management, July 2025, n=602). If your weak dimension is contact accuracy, that's the fastest path to a number leadership actually cares about.
Step 5: How Do You Keep From Sliding Back?
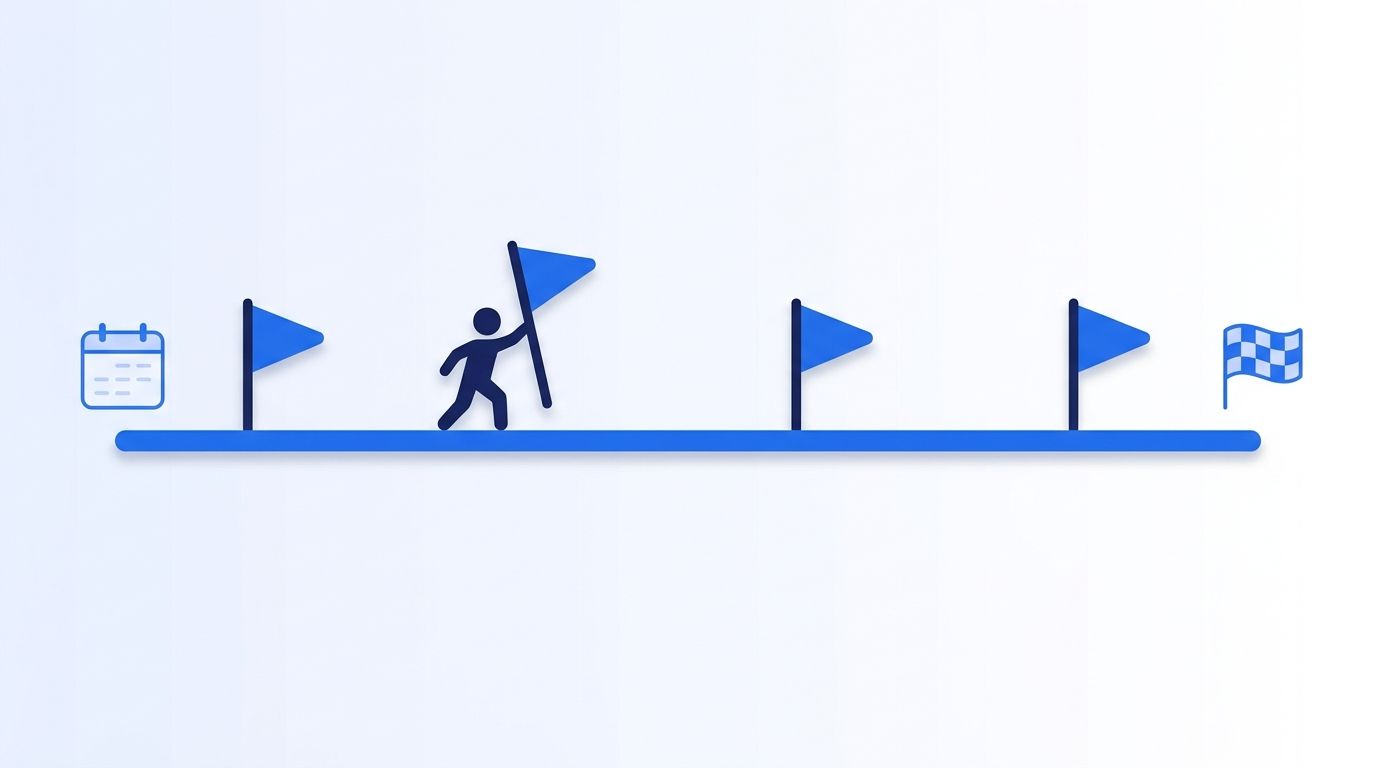
Reaching Stage 4 or 5 isn't permanent if nothing keeps checking your data after the 90-day project ends. B2B contact data decays continuously - not in bursts - at roughly 2.1% a month, compounding to about 22.5% a year across a typical database, with some fields like email decaying far faster (industry-consensus benchmark aggregated via Landbase, 2025-2026; treat as directional). A quarterly cleanse checks that decay four times a year. The decay itself never stops.
This is where real-time verification earns its place in a Stage 5 program. Instead of trusting a database snapshot, a live check against a source like a person's current LinkedIn profile or company page confirms a record's current state at the moment a rep is about to use it, not whenever it was last imported. Pairing that with a credit balance check keeps the monitoring loop itself from silently running out of budget mid-quarter.
For teams building this monitoring layer on top of enriched CRM records, programmatic CRM enrichment and a real-time people enrichment API are the two building blocks most Stage 4-5 teams reach for first.
What Mistakes Should You Avoid?
Roughly 31% of organizations run with no formal data governance framework at all (Tony Mazzarella, PhD, 2025), and a lot of that gap traces back to a handful of avoidable, repeatable mistakes that show up at every stage of the model above. Here are the four we see most often.
1. Scoring the whole org instead of one data domain. A single blended score hides which dimension is actually broken. Score CRM contact data separately from product usage data - they're rarely at the same stage.
2. Buying a tool before writing a standard. Automation without an agreed-upon definition of "correct" just automates inconsistency faster. Standards come before tooling, not after.
3. Treating the assessment as a one-time event. A maturity score from eighteen months ago tells you nothing about today. Re-score quarterly, especially after a CRM migration or a new data source gets added.
<!-- [PERSONAL EXPERIENCE] -->A common pattern in teams evaluating data vendors: they'll invest in a real-time verification API for prospecting data, then leave their internal CRM's historical records on the old quarterly cleanse cycle. Six months later, new records are pristine and old records have quietly decayed back to Stage 2. Monitoring has to cover the whole database, not just what's coming in the door.
4. Skipping the culture dimension. Even great tooling fails if reps route around it because entering clean data feels slower than a shortcut. Isn't it worth asking your team directly what makes clean data entry feel like friction before you roll out a new standard?
What Moving Up a Stage Actually Looks Like
If you've worked through the steps above, you should now have a scored profile across five dimensions, a named bottleneck, and a 90-day plan targeting it. That's the concrete output - not a vague sense that "data quality matters," but a specific number you can re-check in a quarter.
The payoff compounds. Organizations with high AI maturity keep AI initiatives operational for 3+ years at nearly triple the rate of low-maturity organizations - 45% versus 20% (Gartner, June 2025). Data quality maturity isn't a side project anymore. It's the floor every AI and automation initiative gets built on.
Once your CRM foundation is solid, fresh company datasets and fresh people datasets become far more useful additions - enrichment only compounds value on top of a database that's already at Stage 3 or higher.
Frequently Asked Questions
What is a data quality maturity model?
A data quality maturity model is a framework that scores how systematically a team manages data - covering ownership, standards, monitoring, tooling, and culture - across stages from ad hoc firefighting to fully automated, continuous quality control. It gives teams a repeatable way to diagnose gaps instead of relying on gut feeling.
How many stages are in a data quality maturity model?
Most frameworks, including the one in this guide, use five stages: Ad Hoc, Managed, Defined, Quantitatively Managed, and Optimized. This structure mirrors CMMI-based capability models and overlaps with DAMA-DMBOK, which 46.6% of governance-framework adopters already use (Tony Mazzarella, PhD, 2025).
What's the difference between data quality maturity and data governance?
Data governance is the set of policies and roles that define who owns and controls data. Data quality maturity measures how well those policies are actually working in practice - a team can have governance documents on paper and still score low on maturity if monitoring, tooling, and culture haven't caught up.
How long does it take to move up one maturity stage?
Moving up one stage typically takes about 90 days if you target the single weakest dimension rather than trying to fix everything simultaneously. Teams that attempt a full-organization overhaul at once tend to stall, since only 4% of organizations report high maturity in both governance and AI governance together (DATAVERSITY, 2025-2026).
Do we need a dedicated data quality hire to reach higher maturity?
Not to start. Stages 1 through 3 are achievable with a part-time owner and written standards. Reaching Stage 4 or 5 - where metrics and automation run continuously - usually does justify a dedicated role, since 37% of CRM users already report lost revenue tied to poor data quality without one (Validity, 2025).
Ready to See Where Your Data Stands?
You now have a 5-dimension scorecard, a stage, and a 90-day plan targeting your weakest link. The next move is simple: re-score in a quarter, watch the number move, then repeat the same 90-day cycle on whichever dimension is now the weakest one.
If contact and company records are your bottleneck, start with a real-time people enrichment API that checks records at the moment of use instead of on a quarterly schedule - see pricing or read the security and data practices behind how Datamagnet sources and verifies that data.
