
Disclosure: This article is published by Datamagnet. Vendor claims are self-reported unless otherwise noted.
Cost Modeling Your Enrichment Stack: Per-Record Pricing Explained
Your enrichment vendor's pricing page probably lists a per-credit or per-lookup cost. That number is not your real cost. Once you factor in match rate, data decay, and re-verification spend, the "$0.03 per record" line item on a contract can end up costing two or three times that in practice — and most teams never build a model that catches the gap.
Poor data quality costs organizations an average of $12.9 million per year, according to Gartner's data quality research (based on a survey of 154 reference customers across 16 data quality vendor implementations). That's the cost of not modeling your stack. This guide walks you through building a per-record cost model that accounts for what vendor pricing pages leave out, so you can compare enrichment tools on their real cost, not their sticker price.
Key Takeaways
- Sticker price isn't your real cost — match rate, decay, and re-verification spend can push effective cost per record 2-3x above list price.
- B2B contact data decays at roughly 2.1% per month, compounding to about 22.5% annually (HubSpot/MarketingSherpa), so your model needs a re-verification line item.
- 76% of surveyed organizations say less than half their CRM data is accurate and complete (Validity, 2025) — a sign most stacks are already paying for records that don't hold up.
- A working cost model needs six components: vendor inventory, a common per-record unit, match-rate adjustment, decay cost, waterfall logic, and a rebuild cadence.
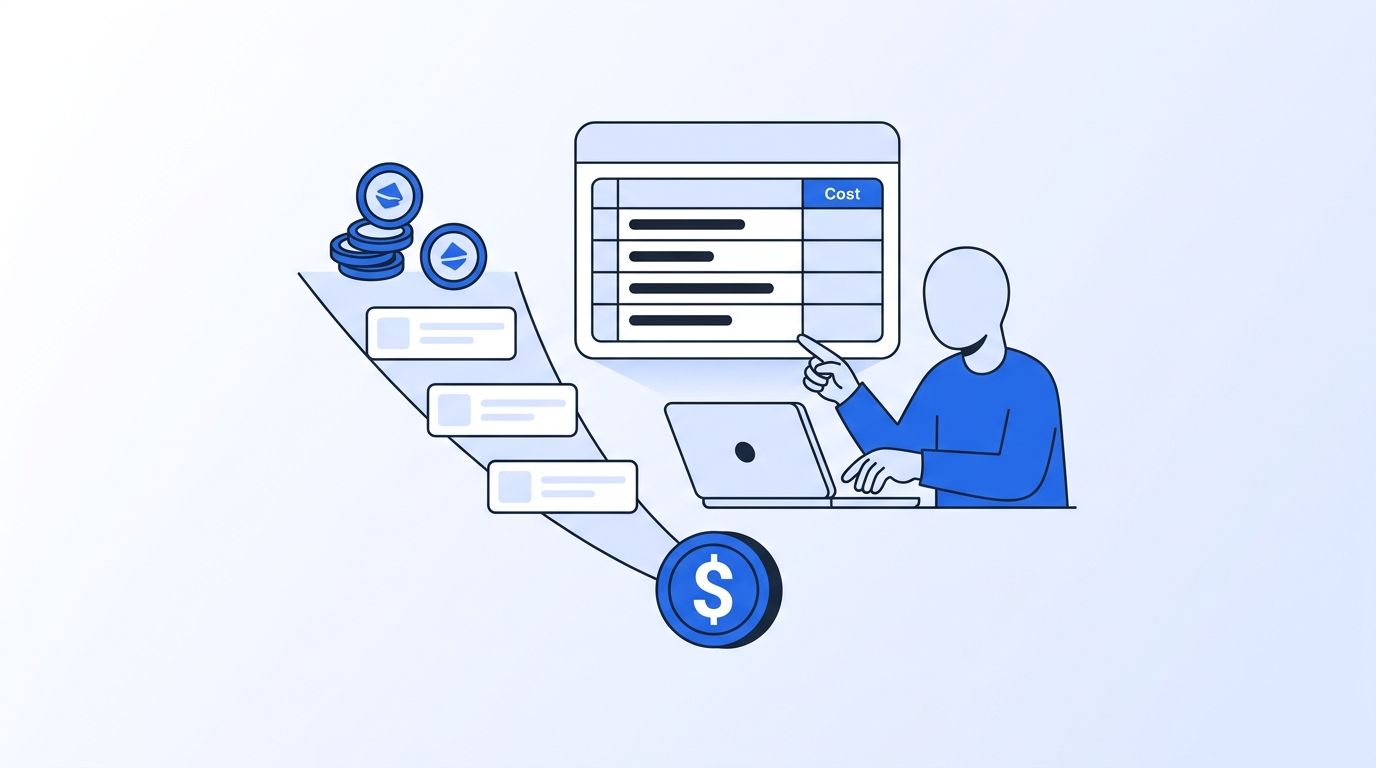
What Does "Cost Modeling an Enrichment Stack" Actually Mean?
Cost modeling means converting every vendor's pricing structure — credits, seats, per-lookup fees, tiered plans — into one common unit: cost per successfully enriched record, not cost per API call. That distinction matters because a call that returns no match still costs you money in most contracts, and it tells you nothing about your actual customer or prospect.
Think of it like comparing airline tickets by seat price instead of price-per-mile-actually-flown. A model built on credits alone will always undercount what you're spending, because credits get consumed by empty lookups just as easily as full ones.
For teams evaluating vendors, Datamagnet's pricing uses a pay-as-you-go, credit-based structure — the same kind of unit you'll need to normalize across every tool in your stack for this exercise to work.
Step 1: Inventory Every Vendor and Pricing Unit in Your Stack
By the end of this step, you'll have a single spreadsheet row for every enrichment vendor you currently pay for, with its raw pricing unit written down exactly as billed. Most stacks aren't one vendor — they're three or four, stitched together as a waterfall or split by use case (people data from one provider, firmographics from another, intent signals from a third). Before you can compare costs, you need to see the whole stack in one place.
- List every vendor currently enriching records in your pipeline.
- Record the raw pricing unit for each: per credit, per seat, per lookup, per API call, flat monthly fee.
- Note the plan tier and any volume discounts or contract minimums.
- Pull your last 90 days of actual usage/spend from billing, not the rate card.
Check the vendor's own credit dashboard, not just the contract PDF — usage patterns drift, and most teams underestimate how many credits get burned on failed lookups. If you're on Datamagnet, you can check your credit balance and consumption in real time through the Credit Balance endpoint rather than waiting for a monthly invoice to find out.
Step 2: How Do You Normalize Every Vendor to a Single Per-Record Cost?
Once your inventory is built, converting every vendor to the same unit is what makes an apples-to-apples comparison possible — this is the step most cost models skip. Take Coresignal's public pricing as an example: their entry "Mini" API plan runs $49/month for 2,500 credits, and a single company or employee record costs 10-20 credits to pull (Coresignal pricing). That works out to roughly $0.02-$0.04 per record before volume discounts — but only if every credit spent returns a usable record. That caveat is the entire point of Step 3.
Most vendor comparison posts stop at listed price per credit. The number that actually predicts your budget is listed price divided by your realized match rate for that specific vendor and record type — a number no pricing page publishes, because it varies by industry, region, and how stale your input data already is.
Convert every row in your Step 1 spreadsheet the same way:
Per-record cost = (Plan price ÷ Credits included) × Credits per record
Do this for every plan tier you're eligible for, not just your current one — volume discounts change the math fast once you cross a threshold.
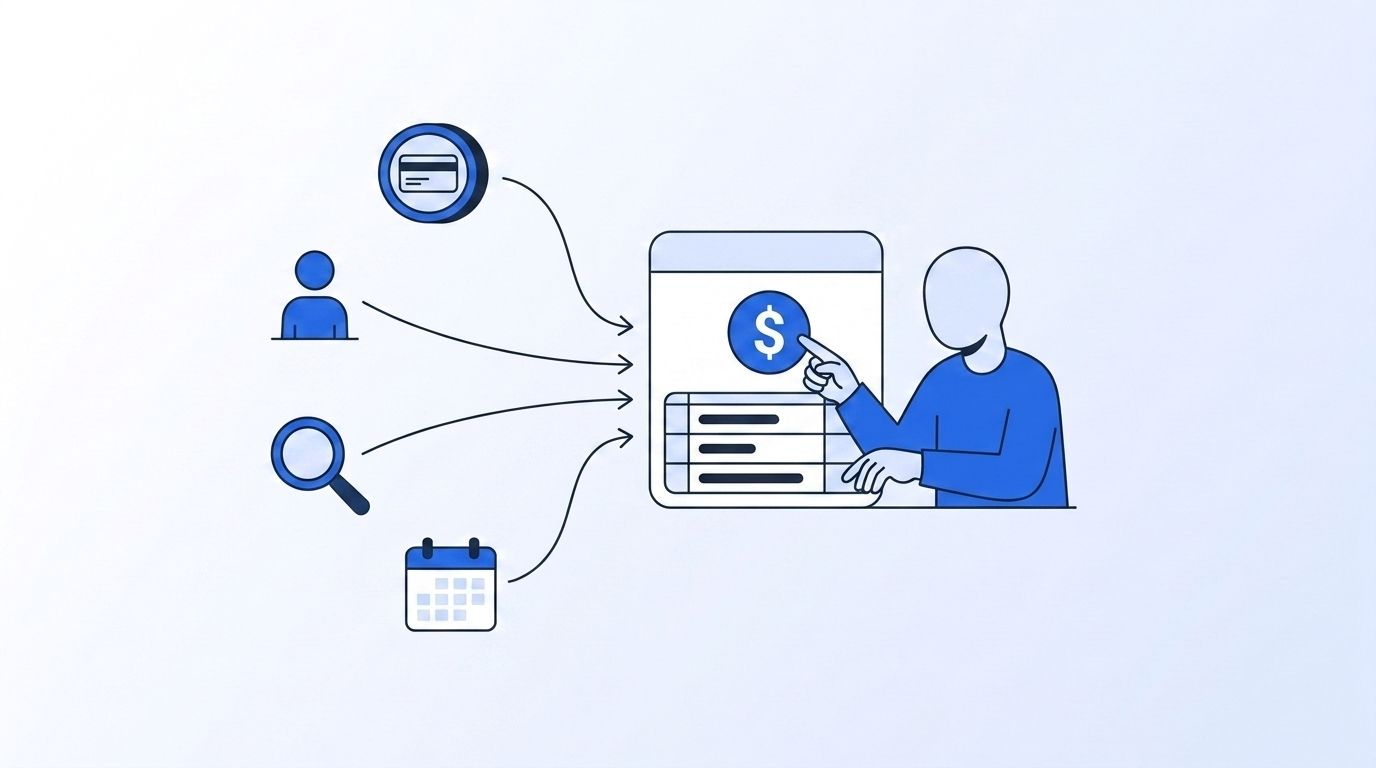
Step 3: How Do You Adjust for Match Rate to Find Your Real Cost Per Successful Enrichment?
Here's the answer up front: divide your per-record cost from Step 2 by your actual match rate, not the vendor's advertised match rate, and you'll usually see the number climb — sometimes sharply. Why does this matter so much? Because a failed lookup still consumes a credit in most billing models, but it delivers zero value to your pipeline. If a vendor's real-world match rate on your specific record set is 70% instead of the "90%+" quoted on the pricing page, your true cost per successful enrichment is roughly 1.3x the sticker price — not a rounding error.
Real cost per enrichment = Per-record cost ÷ Actual match rate
Pull your actual match rate from the last billing cycle, not a vendor's marketing claim. If your provider bills credits even on records it can't find — a common industry pattern for missing or incomplete LinkedIn profiles — that gap compounds fast at volume. Datamagnet's own policy update on credit consumption for missing profiles is a useful reference for how this line item should actually be billed, and worth comparing against whatever your current vendor does.
Isn't it worth an hour with your billing export to find out where that gap actually sits for your stack?
Step 4: Add Data Decay and Re-Verification Costs to Your Model
By the end of this step, your model accounts for the fact that a record you paid to enrich six months ago isn't worth what it was on day one. In 2026, B2B contact databases decay at roughly 2.1% per month, compounding to about a 22.5% annualized decay rate, according to HubSpot's database decay research citing MarketingSherpa data. That means a fifth of the records you enriched a year ago are now stale enough to need a re-pull — and every re-pull is a second cost against the same record.
Add a decay line item to your model using this formula:
Annual re-verification cost = (Records enriched × decay rate at re-check date) × per-record cost
In conversations with RevOps teams sizing this line item for the first time, the reaction is almost always the same: decay cost gets treated as a rounding error until someone runs the actual math against a 12-month-old segment and finds a fifth of it needs to be re-pulled before the next campaign.
Step 5: How Do You Model Waterfall Costs Across Multiple Vendors?
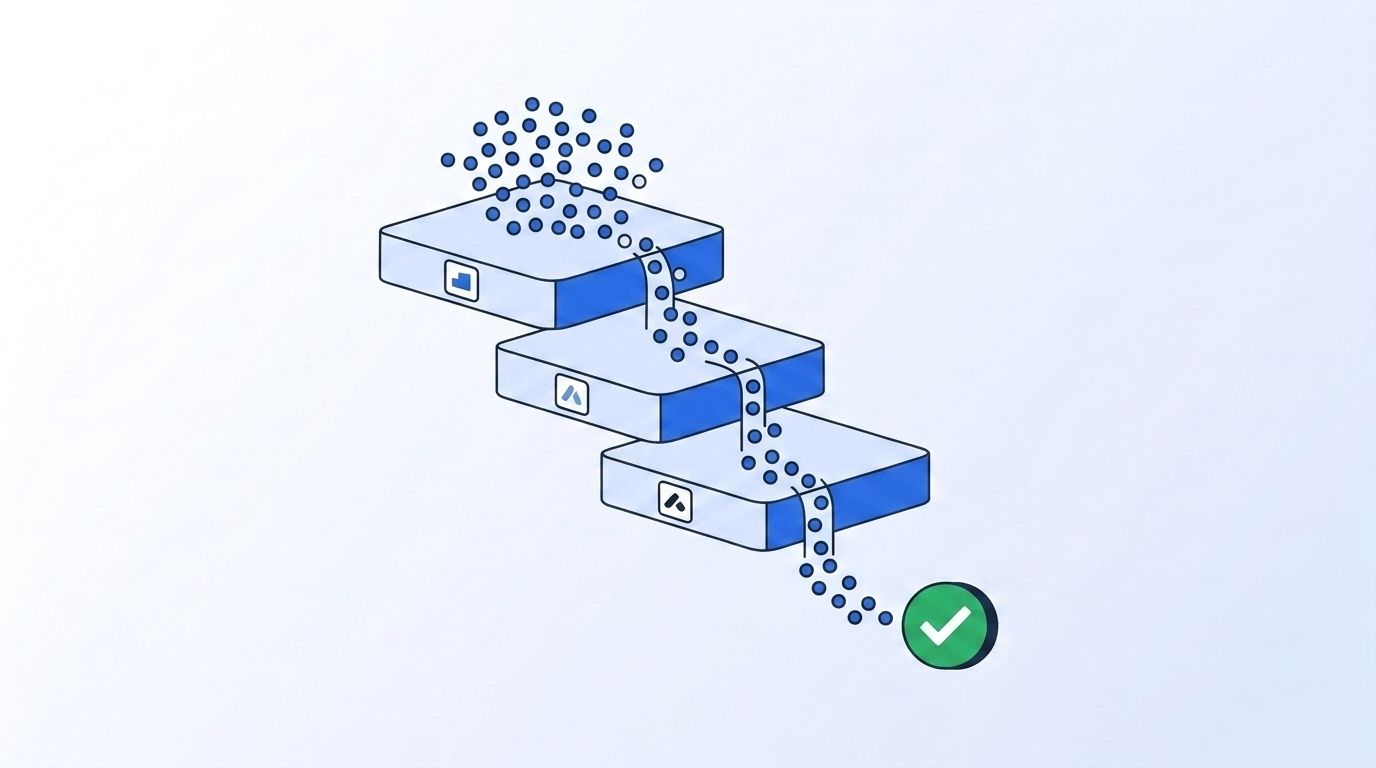
If your stack chains vendors — Vendor A first, then Vendor B for whatever A misses — your model needs to price that fallback logic separately, because each hop in the waterfall adds its own credit spend on top of the last.
The general principle holds regardless of which vendors you're comparing: real-time, request-time data sources (queried live against current public data) versus static or periodically-refreshed databases carry very different decay-cost profiles, which changes how much re-verification spend you should budget into a waterfall built on either approach. It's worth comparing Datamagnet against a request-time competitor like Coresignal or a static-database provider like People Data Labs on this specific dimension before locking in a waterfall order.
Structure the waterfall line item like this:
- First-pass cost: per-record cost × match rate for your primary vendor.
- Fallback cost: per-record cost × (1 − first-pass match rate) × match rate for your secondary vendor, applied only to records the first vendor missed.
- Repeat for each additional hop in the chain.
Every additional hop should show a shrinking marginal return — if it doesn't, that vendor doesn't belong in the waterfall.
Step 6: Set a Cost Alert Threshold and a Rebuild Cadence
Once your model is built, the last step is deciding how often you'll rerun it — a cost model built once and never revisited goes stale just as fast as the data it's tracking. Set two things: a per-record cost ceiling that triggers a review if actual spend crosses it, and a rebuild cadence (quarterly is reasonable for most mid-market teams, monthly if you're scaling volume fast). Tie the alert to your billing export, not a manual check — nobody remembers to open a spreadsheet every 30 days on their own.
What Are the Most Common Mistakes When Cost Modeling Your Stack?
The single most common mistake: comparing vendors on listed credit price alone, without adjusting for match rate. That one oversight means the "cheaper" option on paper is often the more expensive one in practice, once failed lookups get counted against the same contract.
1. Treating advertised match rate as actual match rate. Vendors report match rate under ideal test conditions. Your actual data — messier titles, incomplete records, less common regions — will underperform that number. Pull your own 90-day match rate from billing before trusting a rate card.
2. Ignoring decay until a campaign fails. Most teams only discover a stale segment when a send bounces or a call list goes cold. Build the re-verification line item into your model from day one instead of reacting to it.
3. Comparing per-seat and per-credit pricing side by side without normalizing. A per-seat plan and a per-credit plan aren't comparable until you convert both to cost-per-successful-record at your actual volume. Skipping this step is how procurement teams pick the wrong tier.
4. Never revisiting the model after signing a contract. Pricing tiers, match rates, and your own volume all shift. A model that isn't rebuilt quarterly is measuring last year's stack, not this one.
What Does a Working Cost Model Actually Look Like?
If you've followed the steps above, you should now have a spreadsheet with one row per vendor showing raw price, match-rate-adjusted price, decay-adjusted annual cost, and waterfall position — a single source of truth you can hand to finance instead of a rate card.
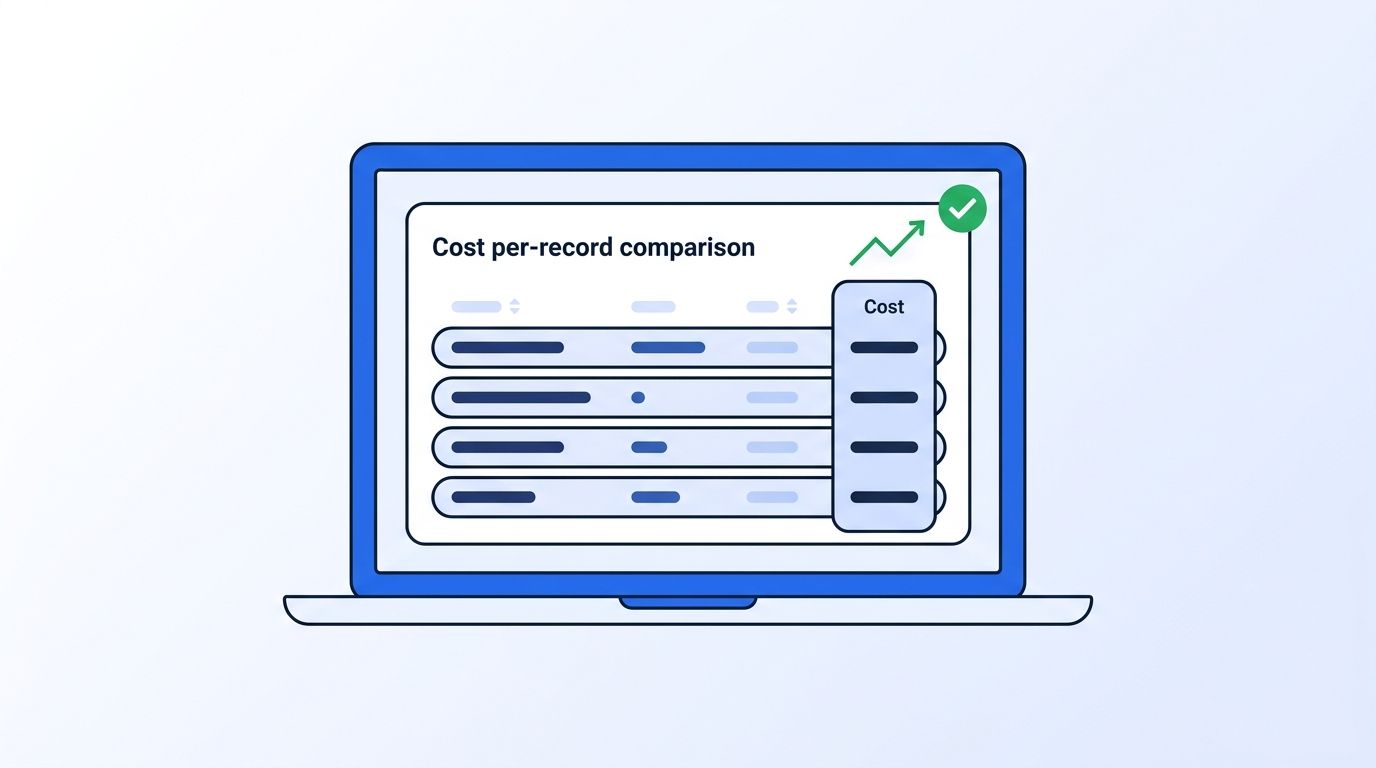
That model is what lets you walk into a renewal conversation and negotiate on real numbers instead of the rate card your vendor handed you.
Frequently Asked Questions
Below are the five questions RevOps and data teams ask most often once they start building a per-record cost model, covering credit normalization across vendors, pricing structure comparisons, rebuild cadence, decay accounting, and what a reasonable benchmark actually looks like. Each answer follows the same match-rate math used throughout this guide.
How do I compare per-record pricing when vendors use different credit systems?
Convert every vendor's plan to a single formula: plan price divided by credits included, multiplied by credits per record. Once every vendor is expressed as a dollar-per-record figure, you can compare them directly — before that conversion, credit systems aren't comparable at all.
Is per-record pricing or seat-based pricing better for a mid-size RevOps team?
It depends on your volume. Per-record (pay-as-you-go) pricing usually wins for teams with variable or lower monthly volume, since you only pay for what you use. Seat-based or flat-fee plans can be cheaper at high, predictable volume — but only after you normalize both to cost-per-successful-record using your actual match rate.
How often should I rebuild my enrichment cost model?
Quarterly for most mid-market teams, monthly if your enrichment volume is scaling fast or you're actively evaluating new vendors. Pricing tiers, match rates, and decay all shift enough over 90 days that a model older than that is measuring a stack you no longer have.
Does data decay really need its own line item in my cost model?
Yes. At a 2.1% monthly decay rate, close to a quarter of your enriched records need re-verification within a year (HubSpot/MarketingSherpa). Skipping this line item means your "per-record cost" only reflects the first purchase, not the ongoing cost of keeping that record usable.
What's a reasonable per-record enrichment cost benchmark to target?
There's no single industry-wide number, because it depends on record type (a full company profile costs more than a single field lookup) and your realized match rate. Instead of chasing a benchmark, use Step 2's normalization formula on your own vendor set — the number that matters is your cost per successful enrichment, not a published average.
Build Your Model, Then Pressure-Test Your Vendors
You now have a six-step framework for converting scattered vendor pricing into one real number: cost per successfully enriched record, adjusted for match rate and decay. That number — not the rate card — is what should drive your next renewal conversation.
Start by pulling your last 90 days of billing data and running it through Step 2's formula today. If you're evaluating whether a live, request-time Company Profile or People Profile source fits better into your waterfall than a static database, see how Datamagnet's request-time model compares before you rebuild your stack around it.
