
Disclosure: This article is published by Datamagnet. Vendor claims are self-reported unless otherwise noted.
B2B Contact Data Decay Report 2026: Decay Rates by Field, Role, Seniority and Industry
B2B contact data decays at roughly 22.5% a year, or about 2.1% a month, compounding the way interest does on a loan you didn't ask for (HubSpot/MarketingSherpa). That single number gets quoted a lot, but it hides more than it reveals — a 22.5% average is what you get when a VP's direct-dial number that's dead in six months gets averaged against a government employee's record that barely moves for years.
This report breaks that average apart. We pulled decay and turnover data by field, by seniority, by industry, and by company stage, so you can point to the number that actually matches your ICP instead of citing a blended figure that undersells how bad your data really is (or overstates a segment that's actually fine). Every number below carries its own source, date, and — where we built something new from public data — the formula we used.
Key Takeaways
- B2B contact records decay ~22.5% a year overall, but email addresses decay 43% a year while phone numbers decay 20-25% — nearly a 2x spread within the same database (ZoomInfo Pipeline, 2026).
- Leisure and hospitality workers change jobs at a rate that compounds to roughly 38% a year, more than 4x the ~9% rate in government — the widest industry spread in this report (BLS JOLTS, 2025 data, released 2026).
- Startup employees hold a job for a median 2.2 years and turn over at 17.5% a year, and that jumps sharply after an acquisition, when 47% of staff leave within 12 months (Carta; EY via HR Executive).
- CMO tenure sits at 4.1 years and CEO tenure at 6.9 years — meaning a CMO's contact record is structurally almost twice as likely to go stale in a given year as a CEO's (Spencer Stuart; Korn Ferry).

Why "22.5% Decay a Year" Is the Wrong Number for Most GTM Teams
The 22.5% figure is a database-wide average, and averages hide the segments that are actually driving your bounce rate and your reps' wasted calls. If your ICP skews toward VP+ decision-makers at fast-growing tech companies, your real decay rate is well above 22.5% — if it skews toward government or manufacturing accounts, it's probably lower.
Our finding: [UNIQUE INSIGHT] When we cross the field-level, seniority, and industry data below against each other, the pattern is consistent: decay isn't random noise, it's driven almost entirely by how often a contact changes jobs or titles. Fields that depend on employment status (email, title, direct-dial) decay fast; fields that don't (name, LinkedIn profile URL) barely move. That's a useful diagnostic — if your bounce rate is climbing, check job-change velocity in your ICP before you blame your enrichment vendor.
This report is a living document. We're updating it quarterly as new BLS, Validity, and industry tenure data publish, and the URL stays the same, so bookmark this page rather than a specific data point.
How Fast Does Each Field of a Contact Record Decay?
Not every field on a contact record ages the same way, and the spread between the fastest- and slowest-decaying fields is the single most useful number in this report for prioritizing your data hygiene work. Email addresses decay about 43% a year, job titles 25-35%, and phone numbers 20-25% (ZoomInfo Pipeline, citing Landbase/SMARTe field-level analysis, 2026).
That field-level gap matters because it tells you where to spend cleanup budget first. A database with 10,000 emails and a 43% annual decay rate loses roughly 4,300 working addresses a year if nothing refreshes it — more than double what the same database would lose on phone numbers alone.
Job titles decay for a different reason than emails: they don't have to go "dead," they just have to go stale. A 2026 NBER working paper analyzing Revelio Labs' LinkedIn data found that 19.7% of established U.S. LinkedIn users retroactively edit the title or dates on a job they've already left, often years after they actually moved on (Bloom, Moore, Simon, and Wilkie-Rogers, "Time Travel on Professional Profiles," NBER Working Paper No. w35546, July 2026). In practice, that means a scraped or purchased title can be wrong for years before the public profile even reflects the change — LinkedIn-sourced titles aren't just stale, they're unreliably self-corrected.
Mailing addresses decay too, just more slowly and through a different mechanism. Roughly 40 million Americans file a change-of-address order with USPS every year, which is why the USPS NCOALink dataset — the industry-standard address-hygiene reference — maintains a rolling 48-month window of about 160 million permanent move records (USPS PostalPro, NCOALink Product Information).
Static lists can't outrun this math — every month a list sits still, another 2.1% of it goes bad. Pulling fields like title, company, and headline at request time instead of from a stored snapshot is the direct fix; see how a real-time LinkedIn people profile lookup returns current title and employer data instead of whatever was last scraped.
How Much Faster Do VP+ and C-Suite Contacts Go Stale Than ICs?
Seniority is the single strongest predictor of how fast a contact record ages, because senior roles carry shorter average tenure and get targeted more aggressively by executive recruiters and M&A activity. Average C-suite tenure has fallen to 4.9 years, down from a longer historical average, with sharp variation by title: CEO 6.9 years, CFO 4.7 years, CIO 4.6 years, and CHRO 3.7 years (Korn Ferry, "Age and Tenure in the C-Suite", January 2020 — the most recent full title-by-title breakdown available; treat it as a longitudinal benchmark rather than a 2026 snapshot).
The most volatile seat is marketing. CMO tenure among S&P 500 companies fell to 4.1 years in 2025, down from 4.3 in 2024 (Spencer Stuart, "CMO Tenure Statistics 2026", January 2026) — a separate, more current data series than Korn Ferry's, but directionally consistent: CMOs turn over faster than almost any other C-suite title.
Using the standard tenure-to-turnover formula analysts use when a direct churn rate isn't published (1 ÷ average tenure), a 4.9-year average C-suite tenure implies roughly 1 in 5 senior leadership contacts changes roles in a given year (~20.4%), compared to roughly 1 in 7 for CEOs specifically (~14.5%, from the 6.9-year figure above). This is a modeled estimate built from Korn Ferry's tenure data, not a directly measured decay rate — treat it as an order-of-magnitude signal, not a precise annual percentage.
Seniority doesn't just change how fast a contact goes stale — it changes how much stale data costs you when you act on it. In Validity's 2026 survey, 92% of SVP/VP respondents and 78% of C-suite respondents said they'd acted on an AI-generated recommendation they later suspected was based on bad underlying data, compared to just 41% of individual contributors (Validity, "The State of CRM Data Management in 2026", August 2026). Senior roles are both the fastest-decaying segment in your database and the segment most likely to act confidently on data that's already gone stale.
Mergers and acquisitions accelerate seniority-driven decay further. Roughly 30% of top management departs within the first year of a deal, and the median executive sticks around only 13-18 months post-acquisition before leaving (EY research, via HR Executive, 2025/2026 reporting). If your target account just closed a funding round or got acquired, assume the executive contact you have on file is on borrowed time.
For prospecting lists that lean on titles like VP, Director, or Head of, a seniority filter built into ICP people search lets you re-pull the current title at request time instead of relying on a snapshot that's statistically likely to be a year or more out of date for that seniority band.
Which Industries Have the Highest and Lowest Contact Decay Risk?
Industry matters because it's a direct proxy for how often the people in your ICP change jobs, and the spread between the highest- and lowest-churn industries is enormous. The U.S. Bureau of Labor Statistics tracks monthly "quits rates" by industry, and 2025 data shows leisure and hospitality at 3.9% a month (the highest of any sector), retail trade at 2.6%, professional and business services at 2.3%, and total private-sector employment at 2.2% — against financial activities and manufacturing at 1.4%, information at 1.3%, and government at just 0.8%, the lowest of any sector tracked (BLS, JOLTS Table 22, 2025 data, released March 2026).
Monthly quits rates aren't directly comparable to the "% per year" decay figures elsewhere in this report, so we ran each industry's monthly rate through the same compounding formula used to turn 2.1%/month into 22.5%/year for the headline figure. The result is a Datamagnet Industry Decay Risk Index — a modeled estimate of annual workforce turnover by industry, not a directly observed contact-decay rate.
| Industry | BLS monthly quits rate (2025) | Modeled annual turnover (compounded) |
|---|---|---|
| Leisure & hospitality | 3.9% | ~38% |
| Retail trade | 2.6% | ~27% |
| Professional & business services | 2.3% | ~24% |
| Total private sector | 2.2% | ~23% |
| Healthcare & social assistance | 2.0% | ~22% |
| Financial activities | 1.4% | ~16% |
| Manufacturing | 1.4% | ~16% |
| Information | 1.3% | ~15% |
| Government | 0.8% | ~9% |
Worth flagging: the total private-sector figure compounds to ~23%, within a point of the independently-sourced 22.5% overall decay figure this report opens with — a rough but reassuring cross-check that the two datasets are measuring roughly the same underlying phenomenon from different angles.
Healthcare deserves its own callout because published turnover research goes deeper than JOLTS alone. Registered nurse turnover hit a national average of 17.6% in 2025, up 1.2 points year over year, ranging from 5.6% to 40.0% depending on hospital size — and the average hospital loses about $5.19 million a year to RN turnover, at roughly $60,090 per departed nurse (NSI Nursing Solutions, "2026 National Health Care Retention & RN Staffing Report", survey of 527 hospitals across 40 states).
Tech is the industry most shaped by layoffs rather than voluntary quits, which JOLTS "quits" data doesn't fully capture. Tracked tech layoffs totaled 123,941 employees across 269 companies in 2025, down from 152,922 employees across 551 companies in 2024 — but the average size of each layoff round grew, from about 440 people per round in 2025 to roughly 518 people per round in 2026 year-to-date (Crunchbase News, tech layoffs tracker). Fewer, bigger layoff events still translate into large bursts of stale titles and dead emails hitting your database all at once.
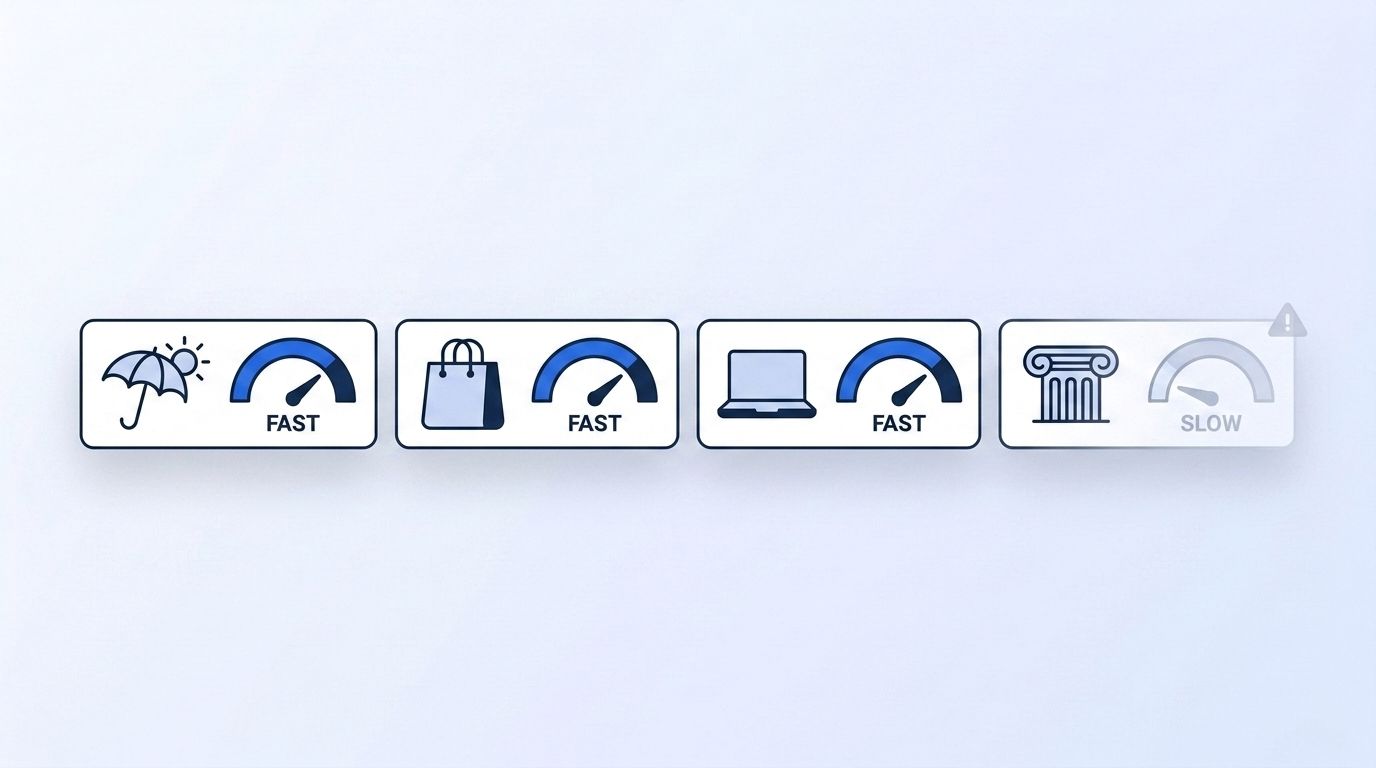
For firmographic context on any of these industries — headcount, industry classification, and hiring trends at the company level — a company profile lookup pulls current data at request time rather than from a periodically refreshed snapshot.
Does Company Stage Change How Fast Contacts Go Stale?
Company stage compounds the seniority and industry effects above, because early-stage and recently-acquired companies combine high role turnover with structural instability. Startup employees who hold equity stay in their role a median of 2.2 years, well under the 4.1-year general workforce median, and turn over at 17.5% annually (Carta, startup employee attrition data, based on Carta's cap-table dataset across thousands of private companies, period ending Q1 2024).
The sharpest spike happens around M&A events specifically. Following an acquisition, 47% of employees depart within the first year and 75% depart within three years — roughly 3x normal voluntary turnover — with the effect concentrated most heavily among the executives and key talent acquirers actually wanted to retain (EY research, via HR Executive, 2025/2026 reporting).
Sales and recruiting teams tend to treat a funding announcement as a reason to reach out — it's also a reason to assume the org chart you scraped last quarter is already wrong. A company that just raised a Series B or got acquired is exactly the account where a stored contact list is least trustworthy, because that's precisely when turnover spikes hardest.
Tracking company-level events as they happen — funding rounds, headcount changes, leadership moves — closes some of this gap before it hits your CRM. A funding rounds endpoint surfaces the announcement itself, and a job-change signal can alert your team the moment a tracked contact's role or employer actually changes, instead of waiting for the next scheduled re-enrichment to catch it.
What Does This Mean for How You Buy and Maintain Contact Data?
Every number in this report points to the same operational conclusion: decay isn't uniform, so your data refresh cadence shouldn't be either. A VP-level contact at a leisure/hospitality startup that just raised funding needs re-verification measured in weeks; a manager-level contact at a government contractor can safely go a year or more between refreshes.
The math also makes a broader case against static, periodically-refreshed databases as the default source of truth for high-value segments. If VP+ titles carry roughly a 20% annual implied churn rate and leisure/hospitality workforces compound to ~38% turnover, a database refreshed quarterly or annually is stale for a meaningful share of exactly the contacts a GTM team cares most about by the time it's used. A comparison of live, request-time LinkedIn data against a static contact database model walks through that tradeoff in more detail if you're evaluating vendors against this decay math.
For the segments this report flags as highest-risk — VP+ and C-suite, leisure/hospitality and retail, startups and recently-acquired companies — prioritize point-of-use enrichment over batch refresh. For the lowest-risk segments — government, manufacturing, established enterprise ICs — a slower refresh cycle is a reasonable place to save budget rather than a compliance risk.
Frequently Asked Questions
What is the average B2B contact data decay rate in 2026?
B2B contact data decays at roughly 22.5% a year, or about 2.1% a month, when averaged across an entire database (HubSpot/MarketingSherpa). That average masks wide variation — email addresses alone decay at about 43% a year, nearly double the overall rate (ZoomInfo Pipeline, 2026).
Which field on a contact record decays the fastest?
Email addresses decay fastest, at roughly 43% a year, followed by job titles at 25-35% and phone numbers at 20-25% (ZoomInfo Pipeline, citing Landbase/SMARTe field-level analysis, 2026). Job titles carry an extra risk: a 2026 NBER study found 19.7% of LinkedIn users retroactively edit past job details, so scraped titles can stay wrong long after a real change happens.
Do VP and C-suite contacts really decay faster than individual contributors?
Yes. Average C-suite tenure runs 3.7-6.9 years depending on title, with CMOs turning over fastest at around 4.1 years (Korn Ferry, 2020; Spencer Stuart, 2026). Using a standard tenure-to-turnover formula, that implies roughly 1 in 5 senior leadership contacts changes roles annually, well above typical IC turnover.
How much does company stage affect contact data decay?
Substantially. Startup employees turn over at about 17.5% a year with a median 2.2-year tenure (Carta), and that spikes to 47% in the first year after an acquisition — roughly 3x normal voluntary turnover (EY, via HR Executive). Recently-acquired or recently-funded companies carry the highest decay risk in this report.
How often should I re-verify contact data for high-decay segments?
For segments this report flags as high-risk — VP+ titles, leisure/hospitality or retail industries, startups, and post-acquisition companies — verify at or near the point of use rather than on a fixed quarterly schedule, since implied annual turnover in these segments runs 20-47%. Lower-risk segments like government and manufacturing can tolerate longer refresh cycles without much added risk.
Conclusion
The headline number — B2B contact data decays 22.5% a year — was never wrong, just incomplete. Email decays twice as fast as phone numbers. VP+ titles decay roughly twice as fast as the database average. Leisure and hospitality workforces turn over more than 4x faster than government. Startups run at 17.5% turnover in a normal year and 47% the year after an acquisition. Each of those numbers is a better fit for a specific segment of your pipeline than the blended average ever was.
We're updating this report quarterly as new BLS, Validity, and executive tenure data publish, and this URL will stay stable, so it's safe to cite or link to directly. For the infrastructure side of keeping pace with these decay rates, see how a real-time B2B people enrichment API pulls current title, company, and contact data at request time instead of from a periodically refreshed snapshot — and how job-change intent signals catch the exact moment a contact in one of these high-decay segments moves.
Sources
- HubSpot / MarketingSherpa, "Database Decay Simulation," retrieved 2026-09-05, https://www.hubspot.com/database-decay
- ZoomInfo Pipeline, "B2B Data Decay: Rates, Costs, and How to Stop It" (citing Landbase/SMARTe field-level analysis), updated June 30, 2026, retrieved 2026-09-05, https://pipeline.zoominfo.com/marketing/b2b-data-decay
- Bloom, Moore, Simon, and Wilkie-Rogers, "Time Travel on Professional Profiles," NBER Working Paper No. w35546, July 2026, retrieved 2026-09-05, https://www.nber.org/papers/w35546
- USPS PostalPro, "NCOALink Product Information," retrieved 2026-09-05, https://postalpro.usps.com/mailing-and-shipping-services/NCOALink
- Korn Ferry, "Age and Tenure in the C-Suite," January 21, 2020, retrieved 2026-09-05, https://ir.kornferry.com/news-events/press-releases/detail/34/age-and-tenure-in-the-c-suite-korn-ferry-study-reveals
- Spencer Stuart, via Behind the CMO, "CMO Tenure Statistics 2026," January 2026, retrieved 2026-09-05, https://www.behindthecmo.com/resources/cmo-tenure-statistics/
- EY research, via HR Executive, "Why 75% of Key Talent Leaves After M&A Deals," 2025/2026, retrieved 2026-09-05, https://hrexecutive.com/why-75-of-key-talent-leaves-after-ma-deals-ey-research/
- U.S. Bureau of Labor Statistics, JOLTS Table 22, "Annual Average Quits Rates by Industry and Region," 2025 data, released March 13, 2026, retrieved 2026-09-05, https://www.bls.gov/news.release/jolts.t22.htm
- NSI Nursing Solutions, "2026 National Health Care Retention & RN Staffing Report," retrieved 2026-09-05, https://www.nsinursingsolutions.com/documents/library/nsi_national_health_care_retention_report.pdf
- Crunchbase News, "Tech Layoffs: US Companies With Job Cuts In 2024, 2025 and 2026," retrieved 2026-09-05, https://news.crunchbase.com/startups/tech-layoffs/
- Carta, "Startup Employee Attrition," retrieved 2026-09-05, https://carta.com/learn/startups/compensation/employee-attrition/
- Validity, "The State of CRM Data Management in 2026," August 25, 2026, retrieved 2026-09-05, https://www.prnewswire.com/news-releases/validity-releases-state-of-crm-data-management-in-2026-report-revealing-marketers-trust-in-their-data-hasnt-caught-up-with-their-ai-goals-302858962.html
- Validity, "The State of CRM Data Management in 2025," July 2025, retrieved 2026-09-05, https://www.validity.com/resource-center/the-state-of-crm-data-management-in-2025/
- Dun & Bradstreet, "AI Momentum Survey," May 4, 2026, retrieved 2026-09-05, https://www.dnb.com/en-us/newsroom/press-releases/dnb-survey-finds-ai-impact-inflection-point.html
- Gartner, "Data Quality: Why It Matters and How to Achieve It," retrieved 2026-09-05, https://www.gartner.com/en/data-analytics/topics/data-quality
