
Account Research Infrastructure for AEs: A 4-Layer Guide
B2B buyers complete 60-70% of their evaluation before they ever talk to a salesperson (ORM Tech, 2026). That means your AE walks into most conversations already behind. If they're piecing together account context on the fly, they're not catching up — they're losing.
Account research infrastructure (defined here) is the integrated system of data sources, tools, workflows, and processes that gives AEs consistent, high-quality intelligence about every target account. It turns research from a time-consuming chore into a repeatable competitive edge. Done right, it means every conversation your AE has is informed and deliberate — not reactive and generic.
TL;DR
- Buyers finish 60-70% of their evaluation before talking to sales, so AEs need pre-built intelligence (ORM Tech, 2026).
- The 4-Layer Stack (Data Foundation, People Intelligence, Trigger Detection, Competitive Context) gives AEs structured, repeatable research.
- Top AEs spend 82% more time on pre-call research than average reps (Prospeo, 2026).
- Companies using sales intelligence platforms see up to 5:1 revenue-to-cost ROI within 90 days (Revnew, 2026).
Why Does Account Research Infrastructure Actually Matter?
AEs currently spend up to 70% of their week on non-selling activities, including manual research, CRM hygiene, and chasing down contact details (Prospeo, 2026). That's not an AE problem. It's an infrastructure problem. When research is systematic and automated, AEs spend that time closing deals instead.
The core issue is that buyers arrive informed and AEs often don't. Buyers have already read comparison pages, watched demos, and built an internal shortlist. When an AE shows up without deep account context, they're responding to a buyer's agenda instead of shaping it.
Systematic research flips that dynamic. An AE who knows a company just raised a Series B, recently hired a new VP of Operations, and uses a competitor your product displaces doesn't just sound prepared. They sound like someone worth talking to.
Citation capsule: AEs spend up to 70% of their week on non-selling tasks, including manual research and CRM updates. Automating data collection through structured account research infrastructure directly reclaims that time, improving both AE productivity and the quality of every outbound interaction (Prospeo, 2026).
What Is the 4-Layer Account Research Stack?
Top AEs spend 82% more time on pre-call research than average reps (Prospeo, 2026) — and the ones who do it well aren't researching harder, they're researching systematically. The 4-Layer Account Research Stack gives you that system. Each layer adds a distinct type of intelligence, and you can implement them one at a time without a rip-and-replace.
The 4-Layer Account Research Stack is a structured framework for building scalable research capabilities incrementally. Each layer adds a distinct type of intelligence. You can implement them one at a time, gain value at each stage, and build toward a full system without a rip-and-replace.
Here's how the layers stack:
- Layer 1 - Data Foundation: Core company firmographics (industry, size, revenue), technographics (what software they use), and financial signals.
- Layer 2 - People Intelligence: Organizational structures, decision-maker profiles, and job change monitoring.
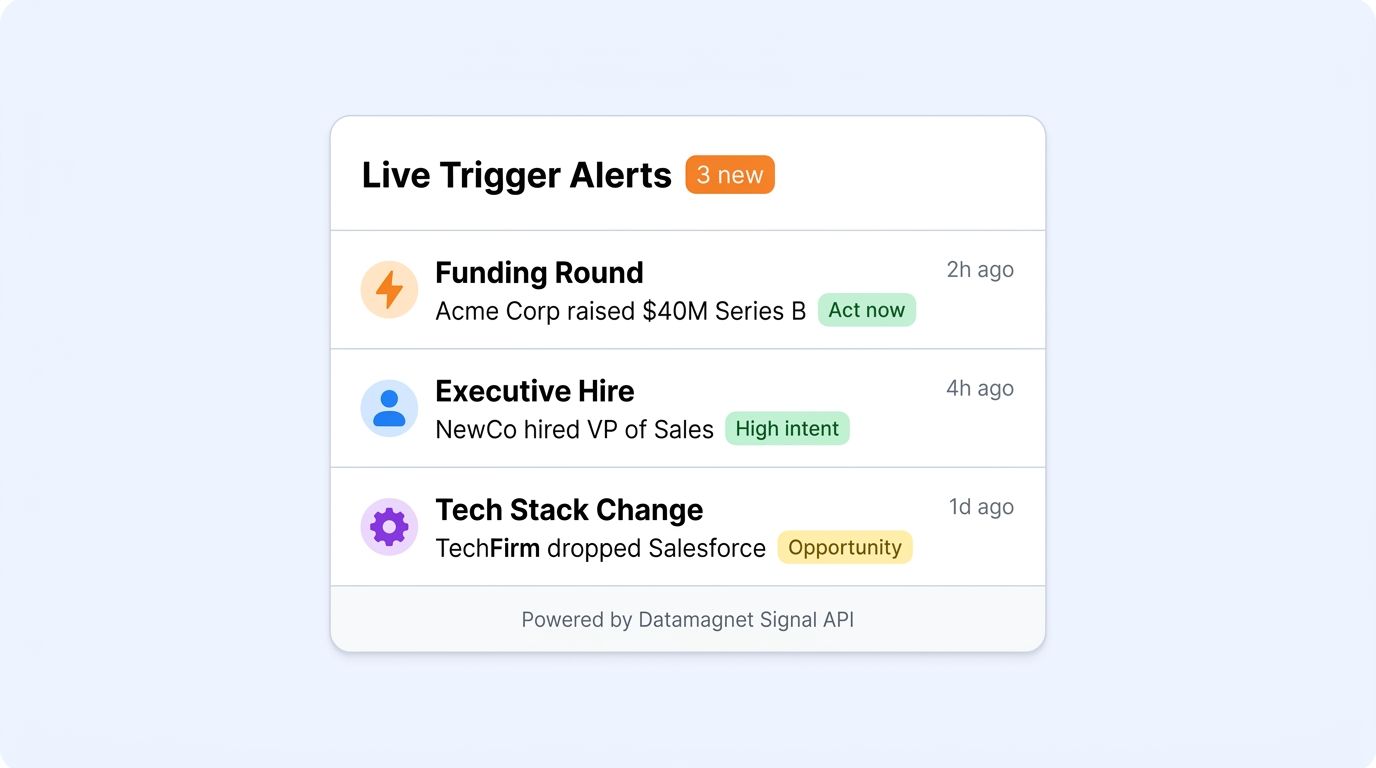
- Layer 3 - Trigger Detection: High-impact events like funding rounds, executive hires, or tech stack changes.
- Layer 4 - Competitive Context: Incumbent vendor data, battle card intelligence, and budget cycle research.
Each layer depends on the one below it. You can't run effective trigger detection without a solid data foundation. And competitive context without people intelligence is just noise.
Most sales teams try to skip straight to Layer 3 (triggers) without building Layers 1 and 2 first. The result is noisy, misdirected outreach. Teams that build sequentially see substantially higher conversion rates because the trigger fires against an already-enriched account record — not a blank CRM entry.
How Do You Build the Data Foundation Layer?
Leading enrichment tools demonstrate what accurate data looks like at scale — under 3% bounce rates and 70M+ weekly data refreshes (Amplemarket, 2026). That's the standard your Data Foundation Layer needs to hit. Without it, every layer above — people intelligence, trigger detection, competitive context — is built on bad inputs.
The Data Foundation Layer is the bedrock of everything else. It provides the essential company and contact information that all subsequent research depends on. Inaccurate data here creates downstream errors: wrong contacts, irrelevant messaging, and wasted AE time.
Selecting a primary data source is the first decision. You want real-time accuracy, broad coverage, and easy CRM integration. Leading enrichment tools like Amplemarket demonstrate what's possible here — under 3% bounce rates and 70M+ weekly data refreshes (Amplemarket, 2026). Datamagnet's Company API and People API are built specifically for this kind of automated, real-time CRM enrichment.
Three practices make the Data Foundation Layer work in practice:
- Automated CRM enrichment: Set up continuous data flows so CRM records stay current without manual effort. A record that's 6 months old is often wrong in two or three fields.
- Refresh cadences: High-value contacts need monthly updates at minimum. Data staleness is silent — you don't notice it until a call bounces or a sequence goes to the wrong person (Default, 2026).
- Waterfall enrichment: "Waterfall enrichment" (jargon defined) means cascading a lookup across multiple data providers in sequence, stopping when a complete record is found. This fills gaps that any single provider will inevitably leave (SyncGTM, 2026).
Citation capsule: Waterfall enrichment cascades lookups across multiple data providers sequentially, stopping when a complete record is found. This strategy fills the inevitable gaps left by any single data source and maximizes CRM coverage. Teams using this approach report significantly fewer incomplete records and lower bounce rates on outbound sequences (SyncGTM, 2026).
Account Research Data Sources: Which One Fits Your Stack?
Different data sources serve different purposes. Here's how the main categories compare:
| Data Source Type | Primary Use Case | Update Frequency | Integration Complexity | Best For |
|---|---|---|---|---|
| Real-time enrichment APIs (e.g., Datamagnet) | Automated CRM enrichment, lead scoring, real-time insights | Real-time to hourly | Low (developer-friendly APIs) | High-velocity sales, precise targeting, data accuracy |
| Traditional data vendors (e.g., ZoomInfo) | Bulk list acquisition, broad market segmentation | Weekly to monthly | Medium | Large-scale prospecting, established market intelligence |
| Intent data providers (e.g., Bombora) | Identifying in-market accounts, predictive scoring | Daily to weekly | Medium | Early-stage pipeline generation, sales prioritization |
| Technographic platforms (e.g., SalesIntel) | Tech stack analysis, competitive displacement | Weekly to monthly | Medium | Targeting based on technology adoption, competitive intelligence |
| Manual research tools (e.g., LinkedIn Sales Nav) | Deep dives on specific contacts, social selling | Manual, real-time | Low | Highly personalized outreach, executive engagement |
| CRM native data | Internal record keeping, historical interactions | Continuous (user input) | N/A | Relationship management, internal reporting |
Technographics (defined): data that tells you what software and technology a company currently uses. It's how you find out a prospect is running a competitor's tool before you call them.
How Do You Build a People Intelligence System?
People Intelligence moves beyond company-level data to focus on the individuals inside target accounts. Enterprise deals typically involve 5-9 stakeholders, and multi-threading (engaging multiple people in the account simultaneously) is essential for higher close rates (LeadHaste, 2026). If you're only talking to one person, you're one internal politics problem away from a dead deal.
The People Intelligence layer has three core components:
- Org chart mapping: Identify the economic buyer (who signs), the technical evaluator (who approves), and the internal champion (who sells for you). Each requires a different message.
- Job change monitoring: Newly hired executives spend 70% of their budget in their first 100 days (Autobound, 2026). Tracking promotions and role changes turns a CRM record update into a sales trigger.
- Automated LinkedIn monitoring: Manually checking LinkedIn profiles doesn't scale. Tools that track public social data automatically surface real-time updates without requiring AE effort. Datamagnet's People API automates the identification and enrichment of these contacts.
Citation capsule: Enterprise B2B deals involve an average of 5-9 stakeholders. AEs who map the full buying committee and engage multiple contacts simultaneously achieve significantly higher close rates than those relying on a single point of contact. People Intelligence systems make this possible at scale without adding manual research burden (LeadHaste, 2026).
What Triggers Should AEs Be Monitoring?
Companies that contact funded firms within 48 hours of a funding announcement see 400% higher conversion rates (Autobound, 2026). Leadership change signals generate 14% response rates versus 1.2% for standard cold outreach. That gap isn't about messaging — it's about timing. The right trigger, acted on fast, changes the whole conversation.
Trigger Detection focuses on high-value events that signal a company is ready to buy — or needs what you sell right now. Not all signals are equal. The best triggers are time-sensitive, specific, and actionable.
Companies that contact funded firms within 48 hours of a funding announcement see 400% higher conversion rates compared to those who reach out later (Autobound, 2026). The window is real and it closes fast.
The three highest-impact triggers to monitor:
- Funding rounds: New capital means new budget and a mandate to grow. This is one of the cleanest buying signals in B2B.
- Executive hires and M&A activity: Leadership changes signal new initiatives and strategic shifts. Leadership change signals generate 14% response rates versus 1.2% for standard cold outreach (Autobound, 2026).
- Tech stack shifts and hiring patterns: A company that just posted 12 data engineer roles is probably building something. A company that just dropped a competitor's tool has a gap to fill. Datamagnet's Signal API provides real-time detection of these events.
Speed matters more here than in any other layer. Response rates decline 30-40% per week after a trigger fires (Prospeo, 2026). The chart below shows exactly how fast that window closes.
Citation capsule: Trigger-based outreach works only when it's fast. Companies contacting funded firms within 48 hours of a funding announcement see 400% higher conversion rates. And leadership change triggers generate 14% response rates, compared to 1.2% for standard cold outreach. Response rates then decline 30-40% per week after the event (Autobound, 2026; Prospeo, 2026).
How Do You Build Competitive Intelligence Into Account Research?
If 200 companies in your ICP use a competitor that just raised prices, that's a displacement opportunity worth acting on immediately (SyncGTM, 2026). Competitive context is the layer that surfaces those signals before a prospect ever mentions a competitor on a call — and it's what moves AEs from reactive to genuinely consultative.
Competitive context is the final layer, and it's where AEs move from being informative to being prepared. It equips them to navigate competitive evaluations, not just react to them.
If 200 companies in your ideal customer profile (ICP) use a competitor that just raised prices, that's a displacement opportunity worth acting on immediately (SyncGTM, 2026). Technographic data surfaces exactly that kind of signal before a prospect ever mentions a competitor on a call.
Three components make competitive intelligence operational:
- Identifying incumbent vendors: Technographic data tells you what a company currently uses. If you know they're running a competitor, you can lead with a targeted displacement angle rather than a generic pitch.
- Battle cards: Easily accessible documents detailing competitor strengths, weaknesses, and your key differentiators. These can be built using insights from call recording tools like Gong and Chorus, which track competitor mentions across sales calls (Rafiki.ai, 2026).
- Budget cycle research: Knowing when a company typically renews contracts or finalizes budgets lets AEs time outreach to align with actual buying windows, not arbitrary follow-up schedules.
So, does your team have a systematic process for any of these three? If the answer is "it depends on the AE," you don't have competitive intelligence — you have anecdotes.
How Do AEs Actually Use Research in Their Daily Workflow?
Top-performing AEs spend 82% more time on pre-call research compared to average reps (Prospeo, 2026). That's not a discipline gap — it's a workflow gap. High performers have systems that make research fast. If your AEs aren't using the data you're paying for, the problem usually isn't motivation. It's that research isn't built into the path of least resistance.
Infrastructure is only valuable if AEs use it consistently. The best data stack doesn't help if research lives in one tool and conversations happen in another.
Top-performing AEs spend 82% more time on pre-call research compared to average reps (Prospeo, 2026). That's not a behavior difference. It's a workflow difference. High performers have systems that make research fast.
Four practices that operationalize research effectively:
- Research templates and checklists: Standardized templates give every AE a consistent starting point. They also make onboarding faster and peer review easier.
- Time-boxing research: For net-new accounts, 20-30 minutes is usually enough. Warm leads may only need 10-15 minutes. "Time-boxing" (defined) means setting a hard time limit to prevent over-researching at the expense of outreach volume.
- Research knowledge base: A centralized repository of account insights, competitive notes, and successful playbooks so AEs aren't rebuilding context from scratch on re-engagement.
- Training on research depth: AEs need to know when to go deep versus when to engage quickly. Not every account warrants a 45-minute dive.
Teams that implement research templates before adding new data tools see higher adoption of both. The template creates a demand for structured data. The data tool fills it. Without the template, new data subscriptions often go underused because AEs aren't sure what to do with the output.
How Do You Measure Whether Your Research Infrastructure Is Working?
Companies using sales intelligence platforms have seen up to a 5:1 revenue-to-cost ROI within 90 days (Revnew, 2026). But aggregate ROI numbers don't tell you which part of your stack is working. You need metrics that connect research inputs to revenue outputs.
Four metrics that actually tell you something useful:
- Time-to-first-meeting: Shorter times indicate more efficient, targeted outreach. If this isn't improving after adding a data layer, the data isn't reaching AEs in a usable format.
- Research-to-meeting conversion rate: How effectively does account research translate into booked meetings? Track this by research depth — light research vs. full 4-layer prep.
- Win rate by research depth: Compare win rates for deals where AEs ran full research versus partial research. This is the clearest proof of infrastructure value.
- Cost per qualified opportunity: Measures pipeline generation efficiency across your full research investment.
One study found a 42% increase in sales velocity and 35% higher win rates after consolidating multiple research tools into a unified stack (Salesmotion, 2026). Zebra Technologies achieved a 12% boost in win rates and a 60% reduction in manual tasks through streamlined account planning (DemandFarm, 2026). The chart below shows these measured outcomes side by side.
Citation capsule: Companies that consolidated multiple research tools into a unified sales intelligence stack saw a 42% increase in sales velocity and 35% higher win rates (Salesmotion, 2026). Zebra Technologies reduced manual account planning tasks by 60% and improved win rates by 12% after implementing streamlined account research infrastructure (DemandFarm, 2026).
Frequently Asked Questions
What is account research infrastructure for sales teams?
Account research infrastructure is the integrated system of data sources, tools, workflows, and processes that equips AEs with consistent, high-quality intelligence about target accounts. It transforms research from an ad-hoc burden into a repeatable, systematic process. AEs currently spend up to 70% of their week on non-selling activities, and structured research infrastructure directly reclaims that time (Prospeo, 2026).
How much time should AEs spend researching each account?
For net-new accounts, 20-30 minutes of structured research is typically enough to prepare a relevant, informed outreach. Warm leads or active opportunities may only need 10-15 minutes of pre-call refresh. Top-performing AEs spend 82% more time on pre-call research than average reps, but efficient infrastructure makes that time go further (Prospeo, 2026).
What data sources do I need to build effective account research infrastructure?
You need at minimum four data types: firmographics (company size, industry, revenue), technographics (tech stack), people data (contacts, org charts), and intent or trigger signals (funding, hires). Real-time enrichment APIs are the most efficient source for automating this across your CRM. Amplemarket, for instance, reports under 3% bounce rates and 70M+ weekly refreshes (Amplemarket, 2026).
How do I integrate account research data into our existing CRM?
Most modern enrichment APIs offer direct CRM connectors or webhook-based integrations that push data into existing records automatically. Datamagnet's API is developer-friendly with low integration complexity — new implementations typically go live in days, not weeks. Data refresh cadences should be configured based on account priority: real-time for active deals, weekly for target accounts (Default, 2026).
What triggers should AEs monitor for account research?
The three highest-value triggers are funding rounds, executive hires, and tech stack changes. Funding triggers generate 400% higher conversion rates when acted on within 48 hours. Leadership change signals produce 14% response rates versus 1.2% for cold outreach. Tech stack shifts signal displacement opportunities or expansion needs (Autobound, 2026).
How do I measure if account research infrastructure is working?
Track four metrics: time-to-first-meeting, research-to-meeting conversion rate, win rate by research depth, and cost per qualified opportunity. Win rate by research depth is the most direct indicator — compare deals where AEs ran full 4-layer research against deals where they didn't. Explore Datamagnet's ICP company search endpoint to start segmenting by research depth.
What is the ROI of investing in account research infrastructure?
Companies using sales intelligence platforms report up to a 5:1 revenue-to-cost ROI within 90 days (Revnew, 2026). Separately, teams that consolidated research tools saw 42% higher sales velocity and 35% better win rates (Salesmotion, 2026). The ROI case is strongest when infrastructure reduces AE research time while improving conversion at each funnel stage.
How do I train AEs to use account research infrastructure effectively?
Start with standardized research templates that tell AEs exactly what to look for at each layer. Then add time-boxing guidelines — 20-30 minutes for net-new, 10-15 minutes for warm leads. Finally, build a shared knowledge base so account insights compound over time rather than living in individual AE heads. Training on research depth helps AEs know when to go deep versus when to engage quickly.
What is the difference between account research infrastructure and sales intelligence tools?
Sales intelligence tools are individual data products — a people enrichment API, an intent data platform, a technographic database. Account research infrastructure is the system that connects those tools into a coherent workflow for AEs. The distinction matters because buying tools without a workflow produces data sprawl. Infrastructure means AEs know what data exists, where to find it, and how to act on it consistently.
How often should account research data be refreshed?
Refresh cadence depends on deal stage and account priority. Active deals need real-time or near-real-time data — stale contact info mid-cycle can kill momentum. Target accounts (in your pipeline but not yet active) should refresh weekly. Total addressable market (TAM) lists can refresh monthly. Data staleness is one of the most common causes of bounced sequences and irrelevant outreach (Default, 2026).
Glossary
Account Research Infrastructure The integrated system of data sources, tools, workflows, and processes that equips sales teams with consistent, high-quality intelligence about target accounts. It transforms research from an ad-hoc task into a systematic, repeatable capability.
Data Foundation The base layer of the 4-Layer Stack. It includes core company firmographics (size, industry, revenue), technographics, and financial signals. All higher-order research layers depend on accurate data at this level.
People Intelligence The second layer of the stack. It covers organizational structures, decision-maker profiles, job change tracking, and stakeholder mapping within target accounts — enabling AEs to multi-thread deals and personalize outreach.
Trigger Detection The third layer. It focuses on identifying high-value events — funding rounds, executive hires, tech stack changes, M&A activity — that signal a company's propensity to buy. Response rates decline 30-40% per week after a trigger fires.
Competitive Context The fourth layer. It includes technographic data about incumbent vendors, battle card development, and budget cycle research. It helps AEs enter competitive evaluations prepared rather than reactive.
Time-Boxing A research discipline where AEs set a hard time limit for pre-call research. Typical guidelines: 20-30 minutes for net-new accounts, 10-15 minutes for warm leads. Time-boxing prevents over-research from reducing outreach volume.
Technographics Data about the software and technology a company currently uses. Technographic data helps AEs identify competitive displacement opportunities and technology-specific pain points before making contact.
Waterfall Enrichment A data strategy where a lookup cascades across multiple data providers in sequence, stopping when a complete record is found. This fills gaps that any single provider leaves and maximizes CRM coverage across your full account list.
